Understanding SIL Pricing Dynamics: Why Status Quo will Persist
- Want to get in touch?
Dean Bowman
December 3, 2025
As the disability sector continues advocating for SIL price increases, it’s worth examining the economic and political dynamics that shape pricing decisions. This analysis explores what policymakers likely observe in the data, the constraints they face, and why the path to price increases may be steeper than many anticipate.
National Cabinet established an 8% annual growth target for NDIS expenditure in June 2023, with government projecting $14.4 billion in savings over four years from July 2024. This creates a binding fiscal constraint that shapes all pricing discussions. Facing such constraints, policymakers cannot rely primarily on provider sentiment, however legitimate, to justify significant expenditure increases. While survey data showing 81% of providers concerned about pricing viability provides important context, it presents challenges as a decision-making foundation: sentiment is subjective, reflects aggregate concerns across diverse service lines, and doesn’t differentiate between calls for margin improvement versus genuine market failure.
Instead, governments facing fiscal constraints tend to rely on objective metrics that provide verifiable signals of market health. Three metrics stand out as particularly useful for pricing decisions:
These metrics offer something sentiment cannot: objective, quantifiable evidence of whether markets are clearing efficiently or experiencing dysfunction requiring intervention.
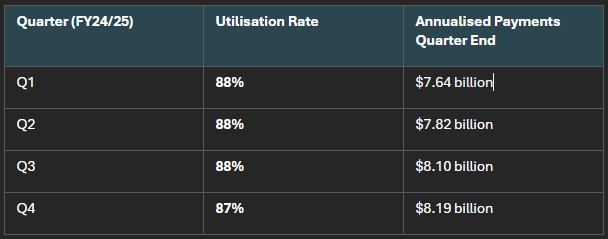
The current SIL utilisation data tells a specific story:
Quarter (FY24/25) | Utilisation Rate | Annualised Payments Quarter End |
Q1 | 88% | $7.64 billion |
Q2 | 88% | $7.82 billion |
Q3 | 88% | $8.10 billion |
Q4 | 87% | $8.19 billion |
Utilisation rates of 87-88% are remarkably high and stable. This consistency across four quarters suggests participants are accessing services, providers are delivering supports, and the market is clearing efficiently at current price levels.
From a policy perspective, 87-88% utilisation represents what efficient markets look like: not too low to signal dysfunction, not so high as to suggest inadequate funding, but in the zone where supply and demand meet effectively.
Compare this to therapy supports, which experienced price freezes for four consecutive years and had travel/access components reduced despite provider advocacy. Therapy supports had utilisation rates below 70%, before the recent pricing intervention. This example demonstrates that treasury likely understand utilisation is an important fiscal tool, and that markets with relatively poor utilisation are still subject to downward market intervention. This places SIL’s utilisation rate firmly outside of the band where one could expect pricing action.
The combination of high utilisation and rapid spending growth tells an important story about supply dynamics:
Year | Participants | Total Payments ($M) | Avg Payment |
2022 | 28,018 | $9,222 | $347,700 |
2023 | 32,973 | $12,254 | $397,900 |
2024 | 35,371 | $14,463 | $422,300 |
2025 | 36,641 | $15,896 | $438,200 |
Growth 2022-2025 | +31% | +72% | +26% |
When spending grows by 72% while utilisation remains constant at 87-88%, it reveals that budgeted/allocated funds are growing substantially (more participants, higher plan values) AND participants are successfully accessing services at the same high rate. This means supply is expanding in lockstep with demand. If budgets had grown but utilisation fell, that would signal supply failure, participants couldn’t spend their allocated funds because services weren’t available. But sustained high utilisation alongside spending growth demonstrates the market is successfully scaling capacity to meet expanding budgeted demand.
While survey data shows legitimate provider concerns about operating conditions, actual capital allocation tells a different story. From the NDS data In 2025:
This creates an interesting dynamic from a policy perspective. Providers are simultaneously:
From a government perspective facing fiscal constraints, this gap between stated sentiment and revealed preference through behaviour becomes relevant. Organisations making rational resource allocation decisions are choosing to expand SIL capacity. This suggests, whatever the challenges in other service lines or smaller providers’ experience, that major players see continuing viability in SIL at current pricing.
When providers allocate scarce capital to expand a service line while simultaneously advocating for price increases in that line, it signals the service remains economically viable even if margins aren’t what providers would prefer.
This isn’t to dismiss provider concerns, operating environments are genuinely challenging, and many organisations face real pressures. But it does suggest that there is a substantial segment of the market demonstrating preference falsification with the view of margin optimisation. It is important to note that the SIL market is notoriously quality opaque, and it is unlikely that quality supports will be able to exert a price signal soon. This does unfortunately mean that SIL will continue a rapid race to the bottom unless quality is effectively priced in. Given the lack of any such mechanism on the horizon, our view is that SIL will continue to behave like a commodity. Which leads to the next question:
One concern worth addressing: what if major providers exit? The SIL market exhibits remarkably low concentration, which provides inherent resilience:
Metric | Annual Amount |
Top 3 Providers Combined NDIS Revenue | $1,250 million |
Annual SIL Market Expansion | $2,200 million |
Market Expansion as % of Top 3 | 176% |
The annual SIL market expansion ($2.2 billion) is 176% of the top three providers’ combined NDIS revenue. This means that even in the extreme scenario where all three major providers simultaneously exited (which is extraordinarily unlikely) the market’s natural growth would absorb their capacity within approximately seven months.
Moreover, there have been provider exits from the NDIS more broadly, yet the utilisation data shows no disruption. The market absorbed these exits without visible impact on service delivery. This is demonstrated resilience that the NDIA are likely aware of. The sector has already stress-tested its ability to maintain function through provider churn, and the data shows it passed that test.
Gresham’s law stated as “Bad money will drive out good money” is a sort of structural race to the bottom that SIL is current subjected to. Presently, from an outside perspective (such as that of participants purchasing SIL for the first time) there are no reliably quality signals that differentiate one SIL product from another. This is exacerbated by the sheer volume of conflicted intermediaries in the sector (unfortunately, many unconflicted intermediaries have been driven out by price freezing).
In the peculiar case of SIL “bad money” can drive out good money with the following advantages.
With the lack of rigorous enforcement, or a visible service standard for SIL, Gresham’s law will play out to its logical conclusion. Noting that while utilization for SIL is high and funding is expanding, Gresham’s law will also likely prevent the improvement of pricing or SIL structuring. In fact, it may worsen it substantially, noting that any degree of freedom offered to the market may be abused for profit generation.
You can see this pattern for yourself by observing Freedom Care Group’s organic growth rate when contrasted against large incumbents who one would have thought, have significant structural advantages.
It’s worth acknowledging the unique political economy of SIL. Government understands that SIL participants typically require substantial 24/7 care with significant safety considerations. These support needs are documented in NDIA planning decisions and involve vulnerable individuals with complex requirements.
This creates an important constraint: any action that threatens SIL supply would be politically challenging regardless of the economic rationale. This is quite different from other support categories where service interruption, while undesirable, might be less immediately critical. This offers SIL some protection against the perverse incentive of the NDIA, to constrain utilisation to find automatic spending savings. The political constraint means SIL pricing likely sits in a particular equilibrium, it cannot be reduced without risking supply to vulnerable participants, but the market signals don’t create pressure for increases either.
Finally, it’s worth considering the fiscal implications of price increases. Current SIL payments are approximately $8.2 billion:
Against a $14.4 billion four-year savings target, these figures represent substantial proportions of the entire fiscal envelope. Treasury would require compelling evidence of market failure to justify such expenditure. The current signals: high utilisation, expanding supply and provider expansion provide the opposite story.
This analysis suggests that substantial SIL price increases face significant headwinds, not because provider concerns aren’t legitimate, but because the objective market signals don’t indicate the systemic failure that would justify major expenditure increases in a fiscally constrained environment.
For providers, this creates strategic imperatives:
The 60% of organisations now focusing on market research, strategy and planning (up from 28% in 2024) suggests the sector is already recognising these imperatives.
Understanding the signals policymakers likely observe: high utilisation, expanding supply, provider investment, helps clarify why price increases may not materialise despite legitimate provider advocacy. This doesn’t invalidate sector concerns about challenging operating environments. But it does suggest that solutions may lie more in business model adaptation, consolidation for scale, and operational efficiency than in waiting for pricing relief that the market signals suggest is unlikely.
The disability sector has demonstrated remarkable resilience and adaptability throughout the NDIS journey. The next phase may require applying that same resilience to operating within the current pricing environment rather than expecting it to change.
This analysis draws on publicly available data from the National Disability Services State of the Disability Sector Reports (2023-2025), financial statements from major providers, and market utilisation data. It represents an economic analysis of policy incentives and market signals, not an endorsement of any particular policy position.
Join an exclusive community of providers receiving our eNewsletter Empathia Insider. Get first access to NDIS business insights, free provider resources, and special offers direct to your inbox.
Empathia Group is a collective of business consultants focused on creating sustainable, long-term success for NDIS service providers.
Appointments outside of standard business hours available by request
Empathia Group Pty Ltd © 2022. All rights reserved.
How are you?
If you’re looking for a sandbox experience with endless meme potential, nextbots sandbox of memes is a must-play! Its creative freedom and varied features allow for truly unique and hilarious gameplay scenarios. Jump in and start building your own meme-fueled chaos!
A really good blog and me back again.
vzom4w
cwnjc9
7seu2t
每天都在战争,希望2026和平.
hacklink,hacklink panel,hacklink satın al , hacklink,hacklink panel,
hacklink satın al , hacklink,hacklink panel,hacklink satın al
How to propose beautifully private proposal in Barcelona
Hacklink satın almak, web siteni Google’da hızlıca üst sıralara taşımak için etkili bir yöntemdir. Hacklink dediğimiz bağlantılar, sıradan backlinklerden farklı …
уличные навесы где заказать навесы
bu2xzj
Hacklink panel avantajları ile tanışın. Toplu link ekleme, zamanlayıcı özelliği ve özelleştirilebilir kampanya seçenekleri.
Качественное SEO https://outreachseo.ru продвижение сайта для бизнеса. Наши специалисты предлагают эффективные решения для роста позиций в поисковых системах. Подробнее об услугах и стратегиях можно узнать на сайте
bedava bitcoin, ücretsiz kripto, casino bonus,
casino sitesi, güvenilir casino, online casino,
canlı casino, slot oyunları, rulet oyna, poker oyna, blackjack oyna,
bahis sitesi, güvenilir bahis, canlı bahis, spor bahisleri, yüksek oran bahis, kaçak bahis,
bedava bahis, deneme bonusu, hoşgeldin bonusu, casino free spin, slot free spin, kumar
sitesi, kumarhane, çevrimiçi kumar, illegal bahis, yasa dışı
bahis, illegal casino, yasadışı kumar, kayıt olmadan bahis, kimlik doğrulama yok bahis,
bahis para yatır, bahis para çek, casino para çekme,
casino para yatırma, slot jackpot, jackpot casino,
bedava casino, ücretsiz casino, casino demo,
canlı krupiye, canlı rulet, canlı blackjack, canlı poker, canlı baccarat, baccarat
oyna, baccarat sitesi, çevrimsiz bonus, yatırımsız
bonus, çevrim şartsız bonus, kayıp bonusu, kayıp iadesi, free bet, freespin, casino cashback, bahis cashback, bedava iddaa, maç
izle bahis, canlı maç bahis, futbol bahis, basketbol bahis, tenis bahis, esports bahis,
sanal bahis, sanal spor bahis, köpek yarışı bahis, at yarışı bahis, greyhound bahis, poker freeroll, escort bayan, escort istanbul, escort ankara, escort izmir, escort bursa, escort adana, escort kocaeli,
escort mersin, escort antalya, escort gaziantep, escort konya, escort
diyarbakır, escort aydın, escort kayseri, vip escort, ucuz escort, eve gelen escort,
otele gelen escort, saatlik escort, gecelik escort, haftalık escort,
çıkmalık escort, rezidans escort, öğrenci escort,
yabancı escort, rus escort, ukraynalı escort, arap escort, sarışın escort,
esmer escort, olgun escort
bedava bitcoin, ücretsiz kripto, casino bonus, casino sitesi,
güvenilir casino, online casino, canlı casino, slot oyunları, rulet
oyna, poker oyna, blackjack oyna, bahis sitesi, güvenilir bahis, canlı bahis, spor bahisleri, yüksek oran bahis, kaçak bahis, bedava bahis, deneme bonusu, hoşgeldin bonusu, casino free spin, slot free spin, kumar sitesi,
kumarhane, çevrimiçi kumar, illegal bahis, yasa dışı bahis, illegal casino, yasadışı kumar,
kayıt olmadan bahis, kimlik doğrulama yok bahis, bahis para yatır, bahis para çek, casino para
çekme, casino para yatırma, slot jackpot, jackpot
casino, bedava casino, ücretsiz casino, casino demo, canlı krupiye, canlı rulet,
canlı blackjack, canlı poker, canlı baccarat, baccarat oyna, baccarat sitesi, çevrimsiz bonus, yatırımsız
bonus, çevrim şartsız bonus, kayıp bonusu, kayıp iadesi, free bet, freespin, casino cashback, bahis
cashback, bedava iddaa, maç izle bahis, canlı
maç bahis, futbol bahis, basketbol bahis, tenis bahis, esports bahis, sanal bahis,
sanal spor bahis, köpek yarışı bahis, at yarışı bahis,
greyhound bahis, poker freeroll, escort bayan, escort istanbul, escort ankara, escort izmir, escort
bursa, escort adana, escort kocaeli, escort mersin, escort antalya,
escort gaziantep, escort konya, escort diyarbakır, escort aydın, escort kayseri, vip
escort, ucuz escort, eve gelen escort, otele gelen escort, saatlik
escort, gecelik escort, haftalık escort, çıkmalık escort,
rezidans escort, öğrenci escort, yabancı escort,
rus escort, ukraynalı escort, arap escort, sarışın escort, esmer escort, olgun escort
May you always find beauty and joy in the simple things of life
Нужен банный веник? купить веник для бани натуральные банные веники помогают улучшить эффект парения и создать особую атмосферу в бане. У нас можно купить веник для бани из березы, дуба или эвкалипта.
bedava bitcoin, ücretsiz kripto, casino bonus,
casino sitesi, güvenilir casino, online casino, canlı
casino, slot oyunları, rulet oyna, poker oyna, blackjack oyna, bahis sitesi, güvenilir bahis, canlı bahis, spor bahisleri, yüksek oran bahis,
kaçak bahis, bedava bahis, deneme bonusu, hoşgeldin bonusu, casino free spin, slot free spin,
kumar sitesi, kumarhane, çevrimiçi kumar, illegal bahis,
yasa dışı bahis, illegal casino, yasadışı kumar,
kayıt olmadan bahis, kimlik doğrulama yok bahis, bahis para yatır, bahis para çek,
casino para çekme, casino para yatırma, slot jackpot, jackpot casino,
bedava casino, ücretsiz casino, casino demo, canlı krupiye,
canlı rulet, canlı blackjack, canlı poker, canlı baccarat, baccarat oyna, baccarat sitesi, çevrimsiz bonus, yatırımsız
bonus, çevrim şartsız bonus, kayıp bonusu,
kayıp iadesi, free bet, freespin, casino cashback, bahis cashback, bedava iddaa,
maç izle bahis, canlı maç bahis, futbol bahis, basketbol
bahis, tenis bahis, esports bahis, sanal bahis, sanal spor bahis, köpek yarışı bahis, at yarışı bahis, greyhound bahis,
poker freeroll, escort bayan, escort istanbul, escort ankara, escort izmir, escort bursa, escort adana, escort kocaeli, escort mersin, escort
antalya, escort gaziantep, escort konya, escort diyarbakır,
escort aydın, escort kayseri, vip escort, ucuz escort, eve gelen escort, otele gelen escort,
saatlik escort, gecelik escort, haftalık escort, çıkmalık escort, rezidans escort, öğrenci escort,
yabancı escort, rus escort, ukraynalı escort, arap escort, sarışın escort, esmer escort, olgun escort
Нужен банный веник? купить дубовый веник натуральные банные веники помогают улучшить эффект парения и создать особую атмосферу в бане. У нас можно купить веник для бани из березы, дуба или эвкалипта.
Противопожарные двери https://zavod-dverimontazh.moscow от производителя с профессиональной установкой в Москве. Изготовление по ГОСТ, сертифицированные конструкции с высокой огнестойкостью. Металлические противопожарные двери для офисов, складов, жилых и коммерческих зданий. Доставка, монтаж, гарантия качества и выгодные цены.
Любишь азарт? пин ап официальный сайт казино предлагает разнообразные игровые автоматы, настольные игры и интересные бонусные программы. Платформа создана для комфортной игры и предлагает широкий выбор развлечений.
Любишь азарт? https://pfrrt.ru предлагает разнообразные игровые автоматы, настольные игры и интересные бонусные программы. Платформа создана для комфортной игры и предлагает широкий выбор развлечений.
Все о строительстве https://dipris-studio.ru и дизайне загородного дома: современные проекты, идеи планировки, выбор материалов, этапы строительства и оформление интерьера. Полезные советы по строительству коттеджей, ремонту и благоустройству участка. Практические рекомендации для владельцев домов и тех, кто только планирует строительство.
Новостной портал https://newsn.ru — свежие новости России и мира, политика, экономика, общество, технологии и культура. Оперативные публикации, аналитические материалы и главные события дня. Узнавайте важные новости первыми и следите за развитием событий онлайн.
Все о строительстве https://sportdon.ru и ремонтах: рекомендации по выбору материалов, технологиям строительства, отделке помещений и дизайну интерьера. Полезные статьи для тех, кто строит дом, делает ремонт квартиры или планирует обновление интерьера.
Портал про здоровье https://vekneboley.ru с полезными статьями о профилактике заболеваний, правильном питании, иммунитете и здоровом образе жизни. Рекомендации специалистов, советы по поддержанию здоровья, физической активности и улучшению самочувствия каждый день.
Портал новостей https://hand-store.ru о высоких технологиях и IT-индустрии. Последние события в мире программирования, искусственного интеллекта, стартапов, гаджетов и цифровых технологий. Читайте обзоры, аналитические материалы и важные новости технологического рынка.
Портал о бытовой https://expert-byt.ru технике и ее эксплуатации. Полезные статьи о выборе техники для дома, правильном использовании, уходе и продлении срока службы устройств. Советы по ремонту, обслуживанию и эффективному использованию бытовой техники в повседневной жизни.
Читайте свежие новости https://иваново37.рф России на новостном портале. Главные события дня, политика, экономика, общество, технологии и культура. Оперативные публикации, аналитика и важная информация о событиях в стране и мире.
Все о смартфонах https://topse.ru мобильных телефонах и гаджетах Sony. Новости, обзоры новых моделей Xperia, характеристики устройств, сравнение смартфонов и полезные советы по выбору техники. Узнайте о новинках Sony, технологиях камер, производительности и возможностях мобильных устройств.
Свежие мировые https://novostizn.ru новости и интересные события со всех уголков планеты. Политика, экономика, технологии, культура, наука и общественная жизнь. Актуальные новости, аналитика и необычные факты о событиях, которые обсуждает весь мир.
Мировые новости https://dikb.ru и интересные события каждый день. Самые важные события политики, экономики, технологий, науки и культуры. Свежие публикации, аналитика и необычные факты о происходящем в разных странах мира.
Live streams http://www.selcuksport.com.az of football matches and sports TV shows online. Football news, schedules, results, and analysis. Follow your favorite teams, watch highlights, and stay up-to-date on the latest news from the world of football.
Противопожарные двери https://zavod-dverimontazh.moscow в Москве от производителя. Надежные металлические двери с высокой огнестойкостью для жилых и коммерческих помещений. Сертификация, соответствие нормам пожарной безопасности, быстрая доставка и установка противопожарных дверей под ключ.
Playmods APK playmods com az is a convenient app for downloading modified games and apps on Android. It offers a large catalog of popular games, fast mod updates, additional features, and a simple interface for easy searching and installation.
Наша лучшая подборка: https://perfumerio.ru/s/carner-barcelona-besos/
Общаешься в максе? приложение макс мессенджер удобный способ найти интересные каналы в мессенджере. Новости, технологии, бизнес, развлечения и другие категории. Просматривайте популярные каналы, открывайте новые источники информации и подписывайтесь.
Консультация семейного юриста поможет быстро разобраться в сложных жизненных ситуациях: развод, раздел имущества, алименты, споры о детях и брачные договоры. Перейдя по запросу юристы по семейным жилищным вопросам – специалист объяснит ваши права, оценит перспективы дела и предложит оптимальный план действий. Получите профессиональную юридическую помощь и ответы на все вопросы по семейному праву.
Строительный портал https://apis-togo.org с полезными статьями о строительстве домов, ремонте квартир и выборе строительных материалов. Советы специалистов, современные технологии строительства, идеи дизайна интерьера и практические рекомендации для ремонта и обустройства жилья.
Строительный журнал https://eeu-a.kiev.ua о строительстве, ремонте и дизайне. Полезные статьи о строительных технологиях, выборе материалов, отделке помещений и обустройстве дома. Практические советы для тех, кто строит дом или делает ремонт.
Строительный портал https://furbero.com с полезной информацией о строительстве домов, ремонте квартир и отделке помещений. Советы по выбору материалов, современные технологии строительства и идеи дизайна интерьера для комфортного жилья.
Все о строительстве https://elektrod.com.ua и ремонте на строительном портале. Советы по выбору строительных материалов, технологиям строительства, отделке помещений и дизайну интерьера. Полезные рекомендации для владельцев домов, квартир и загородной недвижимости.
Полезные статьи https://novostroi.in.ua о строительстве и ремонте на строительном портале. Технологии строительства, выбор материалов, отделка помещений и дизайн интерьера. Практические рекомендации для строительства дома и ремонта квартиры.
Портал про автомобили https://carexpert.com.ua новости автоиндустрии, обзоры новых моделей, тест-драйвы и советы по эксплуатации машин. Полезные статьи для автолюбителей о выборе автомобиля, ремонте, обслуживании и современных автомобильных технологиях.
Автомобильный портал https://autoiceny.com.ua для автолюбителей. Свежие новости автоиндустрии, обзоры автомобилей, тест-драйвы, рекомендации по эксплуатации и обслуживанию машин. Полезная информация о современных автомобилях и автомобильных технологиях.
Все об автомобилях https://eurasiamobilechallenge.com на автомобильном портале. Новости автоиндустрии, обзоры машин, тест-драйвы, советы по ремонту и обслуживанию автомобилей. Узнайте о новых моделях авто, технологиях и событиях автомобильного рынка.
Портал о строительстве https://proektsam.kyiv.ua и ремонте домов и квартир. Полезные статьи о строительных технологиях, выборе материалов, отделке помещений и дизайне интерьера. Советы специалистов и практические рекомендации для обустройства жилья.
Автомобильный портал https://mallex.info с новостями автоиндустрии, обзорами автомобилей, тест-драйвами и полезными советами для водителей. Узнайте о новых моделях машин, технологиях автопроизводителей, обслуживании авто и последних событиях автомобильного рынка.
Информационный женский https://gorod-lubvi.com.ua портал о красоте, здоровье, моде, семье и отношениях. Полезные советы, идеи стиля, рецепты, психология и рекомендации для современной женщины. Узнайте, как заботиться о себе и создавать гармонию в жизни.
Женский сайт https://entertainment.com.ua с полезными статьями о красоте, здоровье, моде, отношениях и саморазвитии. Советы по уходу за собой, идеи стиля, рецепты, психология и вдохновение для современной женщины. Читайте интересные материалы и находите полезные советы для повседневной жизни.
Все для женщин https://novaya.com.ua на одном сайте: мода, красота, здоровье, отношения и семья. Полезные советы по уходу за собой, идеи стиля, рецепты и вдохновляющие статьи для современной женщины.
Женский портал https://happytime.in.ua с полезными статьями о моде, красоте, здоровье, отношениях и семье. Советы по уходу за собой, рецепты, идеи стиля и вдохновение для женщин. Все самое интересное и полезное для современной женщины.
Сайт для женщин https://leif.com.ua с полезными советами о красоте, здоровье, моде и отношениях. Статьи о саморазвитии, семье, стиле жизни и уходе за собой. Узнайте секреты женской красоты и гармонии.
Женский сайт https://martime.com.ua о красоте, здоровье, моде и стиле жизни. Советы по уходу за собой, психология отношений, рецепты и полезные рекомендации для современной женщины. Читайте интересные статьи и вдохновляйтесь.
Все о строительстве https://sevgr.org.ua домов, ремонте квартир и благоустройстве жилья на строительном портале. Полезные статьи, рекомендации специалистов, современные технологии строительства и практические советы по выбору строительных материалов и отделке помещений.
Женский портал https://olive.kiev.ua о моде, красоте и здоровье. Полезные советы, рецепты, психология отношений и идеи стиля. Читайте интересные статьи и находите вдохновение для повседневной жизни.
Сайт для женщин https://tiamo.rv.ua с полезными статьями о красоте, здоровье, моде, семье и отношениях. Рекомендации по уходу за собой, идеи стиля, рецепты и советы для гармоничной жизни.
ремонт совмещенного санузла бюджетный ремонт в ванной
Хотите, чтобы ваш профиль или группа в Одноклассниках росли быстрее? Перейдя по запросу сколько стоит накрутка подписчиков в одноклассники вы сможете увеличить количество подписчиков и активность на странице. Чем больше подписчиков — тем выше доверие и интерес к вашему аккаунту. Начните развивать свою страницу уже сегодня!
You ought to be a part of a contest for one of the highest
quality blogs on the web. I’m going to recommend this website!
Сайт новостей https://antifa-action.org.ua Украины и мира с актуальными событиями политики, экономики, общества и технологий. Читайте свежие новости, аналитические материалы и комментарии экспертов. Все главные события Украины и международной повестки.
Актуальные новости https://kiev-online.com.ua Украины и мира на новостном портале. Политика, экономика, общество, технологии и культура. Свежие события, аналитика и важные новости дня.
Информационный сайт https://mediashare.com.ua новостей Украины и мира. Свежие события политики, экономики, общества и технологий. Главные новости дня, аналитика и комментарии экспертов.
Читайте последние https://kiev-pravda.kiev.ua новости Украины и мира на новостном сайте. Политика, экономика, общество, технологии, культура и происшествия. Оперативные обновления и аналитические материалы.
Свежие новости https://actualnews.kyiv.ua Украины и мира на информационном новостном сайте. Политика, экономика, общество, технологии, культура и происшествия. Оперативные публикации, аналитика и комментарии экспертов. Узнавайте главные события дня и следите за развитием новостей.
Сайт о гипертонии https://gipertoniya.net и повышенном артериальном давлении. Полезные статьи о причинах гипертонии, симптомах, профилактике и современных методах лечения. Советы врачей, рекомендации по питанию, образу жизни и контролю артериального давления.
Портал для женщин https://fotky.com.ua с интересными статьями о моде, красоте, здоровье, семье и отношениях. Полезные советы, рецепты, психология отношений и идеи стиля.
Сайт о финансах https://manorsgroup.com.ua и недвижимости с полезными статьями о инвестициях, покупке и продаже недвижимости, ипотеке и управлении личными финансами. Аналитика рынка, советы экспертов и актуальные новости для тех, кто интересуется финансовыми решениями и недвижимостью.
Строительный сайт https://ko-online.com.ua с полезными статьями о строительстве домов, ремонте квартир и выборе строительных материалов. Современные технологии строительства, советы специалистов, идеи дизайна интерьера и практические рекомендации для ремонта и обустройства жилья.
Медицинский портал https://lpl.org.ua с полезными статьями о здоровье, профилактике заболеваний и современных методах лечения. Советы врачей, рекомендации по правильному питанию, укреплению иммунитета и здоровому образу жизни.
Онлайн журнал https://mts-agro.com.ua о садоводстве и дизайне участка. Советы по выращиванию растений, уходу за садом, ландшафтному дизайну и обустройству дачного участка. Идеи для сада, рекомендации по посадке цветов, деревьев и созданию красивого и уютного пространства.
Все о строительстве https://mia.km.ua и ремонте на одном сайте. Полезные советы по выбору строительных материалов, технологиям строительства, отделке помещений и дизайну интерьера. Практические рекомендации для тех, кто строит дом или делает ремонт.
Новостной портал https://sevsovet.com.ua с актуальными новостями Украины и мира. Политика, экономика, общество, технологии и культура. Оперативные новости и аналитические материалы.
Женский портал https://socvirus.com.ua о моде, красоте и здоровье. Полезные советы по уходу за собой, психология отношений, идеи стиля и рекомендации по здоровому образу жизни.
Фитнес-портал https://sportinvent.com.ua о тренировках, здоровом образе жизни и правильном питании. Программы тренировок, советы тренеров, упражнения для дома и зала, рекомендации по похудению и набору мышечной массы. Узнайте, как улучшить физическую форму и поддерживать здоровье.
Хотите быстро развить канал на Rutube? Накрутка подписчиков Rutube поможет увеличить аудиторию, повысить доверие к каналу и ускорить продвижение видео. Перейдя по запросу накрутка просмотров рутуб кворк вы получите живых подписчиков, плавное добавление и безопасные методы продвижения. Отличное решение для новых и развивающихся каналов, которым важно быстрее набрать активность и привлечь больше просмотров. Начните рост канала уже сегодня.
Статьи о маркетинге https://reklamspilka.org.ua PR и рекламе для бизнеса и специалистов. Практические рекомендации по продвижению брендов, управлению репутацией, контент-стратегии, рекламе в интернете и эффективным коммуникациям с клиентами.
Сайт новостей https://vestionline.com.ua Украины и мира с ежедневными обновлениями. Политика, экономика, общество, технологии и культура. Узнавайте последние события и следите за новостями.
Женский интернет-портал https://ledis.top о красоте, здоровье, моде и стиле жизни. Советы по уходу за собой, психология отношений, рецепты и полезные статьи для современной женщины.
Мастерская креативных идей https://rusproekt.org изготовление авторской мебели и текстиля, создание уникального декора и фитодизайна. Отделочные работы в стиле кантри и прованс, оформление интерьеров и индивидуальные дизайнерские решения для дома, кафе и загородных пространств.
Свежие новости https://zoobonus.com.ua Украины и мира в одном месте. Политика, экономика, общество, технологии, культура и происшествия. Актуальные события и аналитические материалы.
Спортивный журнал https://beachsoccer.com.ua о мире спорта. Новости спортивных событий, обзоры матчей, аналитика соревнований и интервью со спортсменами. Читайте актуальные статьи о футболе, хоккее, теннисе, боксе и других популярных видах спорта.
Портал о здоровье глаз https://eyecenter.com.ua и зрении человека. Советы по профилактике заболеваний глаз, улучшению зрения, правильной работе за компьютером и уходу за глазами. Полезные статьи о здоровье глаз и современных методах коррекции зрения.
Чайный портал https://etea.com.ua для любителей чая. Статьи о разных сортах чая, традициях чаепития, способах заваривания и пользе чая для здоровья. Узнайте больше о культуре чая, популярных напитках и интересных фактах о чае.
Портал о технологиях https://helikon.com.ua и инновациях: новости IT, обзоры гаджетов, смартфонов и компьютеров. Статьи о цифровых сервисах, искусственном интеллекте и технологических трендах.
Журнал о строительстве https://bms-soft.com.ua и ремонте для дома и квартиры. Полезные статьи о строительных технологиях, отделке помещений, выборе материалов и ремонте. Советы специалистов, идеи для интерьера и практические рекомендации.
Накрутка подписчиков Rutube поможет быстро увеличить аудиторию канала и повысить доверие к контенту. Живые подписчики создают активность, улучшают видимость роликов и привлекают новых зрителей. Перейдя по запросу накрутить подписчиков на рутуб канал вы получите быстрый старт канала, безопасные методы продвижения и стабильный рост аудитории без отписок. Отличное решение для тех, кто хочет быстрее развить канал на Rutube.
Женский портал https://psilocybe-larvae.com о красоте, здоровье, отношениях и саморазвитии. Полезные советы для женщин, идеи для дома и семьи, мода, психология, рецепты, лайфхаки и вдохновение на каждый день. Читайте статьи, находите полезную информацию и улучшайте свою жизнь.
Мужской портал https://hooligans.org.ua о стиле жизни, здоровье, карьере и саморазвитии. Статьи о спорте, отношениях, финансах, технологиях и мужских интересах. Полезные советы, лайфхаки и вдохновение для современных мужчин.
Информационный автожурнал https://real-voice.info о мире автомобилей. Новости автопрома, обзоры новых моделей, тест-драйвы, сравнения машин, советы по эксплуатации и обслуживанию. Полезные материалы для автолюбителей, владельцев авто и тех, кто выбирает автомобиль.
нужен биг бэг? https://big-bag-mkr.ru: прочные биг-бэги для стройматериалов, зерна, гранулята и других сыпучих продуктов. Производство под заказ и со склада, консультация, расчет, доставка по РФ.
hire car montenegro https://www.montenegro-car-rental-hire.com
Justin TV Azerbaijan https://justin-tv.com.az main page: live match watch, football, big matches, basketball, UFC and game schedule sections.
Продажа квартир https://kvartira778.ru в Санкт-Петербурге от собственников и агентств недвижимости. Актуальные объявления о продаже квартир в новостройках и на вторичном рынке.
Lamine Yamal https://www.lamine-yamal.com.az Barcelona career, statistics, age, where he is from and basic biographical facts. Lamine Yamal profile on one page.
Продажа квартир https://nedvizhkavspb.ru в Санкт-Петербурге. Большой выбор недвижимости на первичном и вторичном рынке: студии, однокомнатные, двухкомнатные и просторные квартиры в разных районах города. Актуальные предложения, удобный поиск и помощь в покупке жилья.
Продвигайте свой аккаунт быстрее с помощью накрутки подписчиков в TikTok. Перейдя по запросу реальные подписчики тик ток Кворк вы сможете увеличить количество фолловеров, повысить доверие к профилю и привлечь больше просмотров и лайков. Быстрая и безопасная накрутка поможет вашему контенту попасть в рекомендации и ускорить рост аккаунта. Подходит для блогеров, брендов и бизнеса, которые хотят развиваться в TikTok и получать больше охватов.
Hacklink panel avantajları ile tanışın. Toplu link ekleme, zamanlayıcı özelliği ve özelleştirilebilir kampanya seçenekleri. 5078
детский стоматолог https://lechenie-zubov-detyam.ru
ремонт ванна комната ремонт ванной комнаты под ключ
Бесплатная консультация семейного юриста — это возможность быстро разобраться в сложной ситуации и понять свои права. Перейдя по запросу адвокат по браку юрист поможет вам по вопросам развода, алиментов, раздела имущества, опеки над детьми и другим семейным спорам. Разъясним перспективы дела и подскажем оптимальное решение. Получите профессиональную помощь без оплаты и лишних обязательств.
Бесплатная консультация юриста по расторжению брака поможет разобраться в ваших правах и возможностях при разводе. Специалист объяснит порядок развода через суд или ЗАГС, подскажет, как решаются вопросы раздела имущества, алиментов и проживания детей. Перейдя по запросу цены на адвоката по разводам в Москве вы получите профессиональные рекомендации и ответы на все вопросы, чтобы пройти процедуру развода максимально спокойно и с защитой ваших интересов.
ремонта ванной комнате ключ https://remont-vannoy-spb.ru
Need a multimedia system? equipment for conference halls We integrate multimedia systems for home and business. We install and configure audio and video systems, manage content, and integrate equipment into a single system. Modern solutions for comfortable and efficient use of technology.
Greetings, There’s no doubt that your website might be having internet browser compatibility
problems. Whenever I take a look at your site in Safari, it looks fine however when opening in IE, it has some overlapping issues.
I simply wanted to give you a quick heads up!
Besides that, excellent blog!
Юридическая консультация по разделу имущества поможет защитить ваши права и избежать ошибок при разводе или спорах между собственниками. Переходите по запросу юридические услуги по разделу бизнеса – юрист оценит ситуацию, разъяснит перспективы дела, подскажет, как правильно оформить документы и выстроить стратегию. Вы получите чёткий план действий и поддержку на каждом этапе — от переговоров до суда.
Все лучшее здесь: https://aromatmasla.ru/bergamot/sochetanie-bergamota.html
Хочешь казино бонус? https://t.me/s/casino_bonus_bezdep/25 всегда актуальные бонусы в онлайн казино. Получайте бонусы без вложений, фриспины и подарки за регистрацию. Актуальные предложения, честные условия отыгрыша и список проверенных казино с бонусами без депозита.
Лучшие казино казино на реальные деньги через сбп: актуальный список онлайн казино с высоким рейтингом, быстрым выводом средств и выгодными бонусами. Обзор лицензий, игр и платежных методов поможет выбрать надежное казино для комфортной игры.
Халява казино рейтинг казино с бонусами за регистрацию: фриспины за регистрацию, бонусы без пополнения и акции для новых игроков. Сравнивайте условия отыгрыша, выбирайте проверенные онлайн казино и начинайте играть бесплатно с возможностью вывода выигрыша.
Лучшие фриспины 2026 бездепозитные фриспины: бесплатные вращения в онлайн казино без вложений. Подборка проверенных сайтов, бонусы за регистрацию, честные условия отыгрыша и возможность вывода выигрыша без риска для игроков.
Официальный сайт покерок скачать: регистрация, вход, бонусы и игра в онлайн покер. Обзор возможностей, турниров, кеш-столов и мобильного приложения. Узнайте, как начать играть и выводить деньги на проверенной платформе.
Every buyer read more should decode VIN number before purchasing any used vehicle.
Every buyer check vin number should check VIN history to confirm clean title and no major accidents.
Luxury travelers https://www.privatejetcharterfly.com choose charter flights for privacy comfort and schedule flexibility.
Transparent pricing https://rentprivatejetfly.com helps you understand exactly how much a private jet costs per flight.
Нужен дизайн участка? ландшафтный дизайн дачного участка проектирование и благоустройство участка с учетом рельефа, растений и стиля. Создаем красивые и функциональные решения для частных домов и дач, подбираем материалы и обеспечиваем качественную реализацию проекта.
Брендирование сувениров https://4youcreation.kz/tisnenie/ в Алматы по современным технологиям. Специалисты предлагают лазерную гравировку, УФ-печать и термоперенос на ткани, стекло, металл и пластик. Организуют доставку по всему Казахстану.
Компания FarbWood https://farbwood.by предлагает пиломатериалы из сибирской лиственницы для частного и коммерческого строительства в Минске и по всей территории Минска. Мы работаем только с лиственницей сибирской, сосна и ель используются как дополнение к основному ассортименту древесины.
Нужна накрутка соц сетей? накрутка просмотров тг увеличение подписчиков, лайков и просмотров для продвижения аккаунтов. Быстрый старт, безопасные методы и живая активность помогут развить профиль и повысить вовлеченность в популярных социальных платформах.
The best porn generator uncensored ai video generator your fantasies remain strictly between you and the neural network. Instant, high-quality generation, extensive scenario and character customization.
Только лучшее здесь: https://mixstuff.ru/archives/316806
Бесплатная консультация юриста по взысканию алиментов — первый шаг к защите ваших прав и интересов ребёнка. Переходите по запросу юристы по алиментам по горячей линии и получите разбор именно вашей ситуации, узнайте порядок действий, какие нужно собрать документы и оценку перспектив дела. Поддержка на каждом этапе — от обращения в суд до фактического получения алиментых выплат. Запишитесь уже сегодня!
Growth-focused store verified business manager facebook is built specifically for performance marketers who value transparency, speed, and predictable account quality. A loyalty program with cashback on every order makes repeated purchases more cost-effective for teams with regular sourcing requirements. Join thousands of satisfied advertisers who source their campaign infrastructure from a verified and trusted marketplace.
Dedicated platform ageddiscord account for sale helps performance teams find the right account infrastructure for scaling their advertising operations efficiently. Bulk buyers benefit from volume discounts, dedicated account managers, and priority restocking that ensures uninterrupted supply for active campaigns. Scale your advertising operations on a foundation of quality — verified profiles, complete credentials, and expert operational support.
Growth-focused store gmail accounts buy is built specifically for performance marketers who value transparency, speed, and predictable account quality. Bulk buyers benefit from volume discounts, dedicated account managers, and priority restocking that ensures uninterrupted supply for active campaigns. Instant delivery, verified quality, and dedicated support — everything a professional advertiser needs in one marketplace.
Verified marketplace cheap account google ads provides access to a wide catalog of digital profiles for advertising and media buying. Product cards display exact specifications including account age, verification level, included assets, geo origin, and current stock availability. Scale your advertising operations on a foundation of quality — verified profiles, complete credentials, and expert operational support.
Premium marketplace order old instagram accounts features an extensive inventory updated daily across all major geos including USA, Europe, and Asia-Pacific regions. Detailed usage guides help buyers understand the differences between softreg, selfreg, farmed, and reinstated account types before purchasing. Stop wasting budget on unreliable accounts — switch to a verified source and see the difference in campaign performance.
Leading store outlook pva gives media buyers access to aged, warmed, and verified profiles sorted by geo, trust level, and ad readiness. The platform combines speed and reliability — most products are delivered automatically within minutes after payment confirmation. Every order comes with clear documentation, replacement guarantees, and access to a growing knowledge base of operational resources.
Dedicated platform protonmail recovery helps performance teams find the right account infrastructure for scaling their advertising operations efficiently. The marketplace serves a global buyer base with English-speaking support available via Telegram for product selection and order management. Instant delivery, verified quality, and dedicated support — everything a professional advertiser needs in one marketplace.
Quality-focused marketplace how to bypass reddit permanent ban runs multi-step verification on every listing before it reaches the catalog to protect buyer interests. Quality monitoring runs continuously — accounts are spot-checked after listing to maintain catalog integrity and buyer satisfaction rates. Access the full catalog today and discover why top-performing affiliates and agencies choose this platform for their account needs.
Modern platform spam filter yahoo mail caters to solo buyers and agencies who need reliable accounts at scale with volume pricing and priority restocking. Geo-targeted options cover USA, UK, Germany, France, Poland, Ukraine, and other regions with proper IP history and locale settings. A single trusted supplier for all account needs simplifies operations and reduces the risk of working with unverified sources.
Experienced supplier pre monetized youtube channel offers complete asset packages including login credentials, recovery access, 2FA codes, cookies, and user-agent data. Quality monitoring runs continuously — accounts are spot-checked after listing to maintain catalog integrity and buyer satisfaction rates. Scale your advertising operations on a foundation of quality — verified profiles, complete credentials, and expert operational support.
I was about to cancel my gym membership because spring allergies made outdoor running impossible and even the gym air felt heavy.
A trainer suggested I try a different antihistamine.
I found Allegra on Medistorehub for a
steal. Now I pop one before my workout, and I can breathe deeply through my entire routine.
Finally back to setting those personal records.
Юридическая помощь по защите прав ребенка — это поддержка в самых важных ситуациях: от споров о месте проживания и алиментах до защиты от насилия и нарушения прав в школе. Переходите по запросу адвокат по правам ребенка стоимость и квалифицированный юрист поможет отстоять интересы ребенка, подготовить документы и представить ваши интересы в суде, обеспечив безопасность и справедливость.
услуги по разработке дизайна студия дизайна и интерьера
интерьер дизайн студии https://dizayn-interera-spb.ru
заказать дизайн дома частного дизайн проекты домов
дизайн в спб дизайн студия интерьера санкт петербург
студии дизайна интерьера спб интерьер дизайнер
дизайн дома заказать дизайн интерьера загородного дома цена
Тензоприбор предлагает калибровочные гири для весов нужного класса точности и номинальной массы для калибровки весов.
В нашей компании можно купить гири для калибровки весов классов точности E1, E2, F1, F2, M1, M2.
Чем выше класс точности, тем меньше будет разница между номинальным и действительным значениями массы калибровочной гири.
проект дома дизайн https://dizayn-interera-doma.ru
The best porn generator ai sexting bot your fantasies remain strictly between you and the neural network. Instant, high-quality generation, extensive scenario and character customization. Available 24/7. For adults.
Последние изменения: https://logical-grape-sgk1j1.mystrikingly.com/
Guitar players bestguitarreview.com rely on unbiased reviews to compare electric acoustic and bass guitars.
Reliable source best planar magnetic headphones ranks the best headphones of 2026 based on audio quality and value for money.
Expert picks http://www.bestmicrophoneguide.com highlight the best microphones for podcasting vocals streaming and live performance.
Полная версия статьи: http://newsrosprom.ru/zakazat-vysokopoligonalnuyu-model-dlya-agr-kak-vsyo-ustroeno.html
Советы автомехаников https://proavtomaster.com полезные рекомендации по ремонту и обслуживанию автомобиля. Узнайте, как продлить срок службы двигателя, подвески и электрооборудования, избежать частых поломок и сэкономить на ремонте благодаря практическим советам специалистов.
Профессиональный автосервис https://km-motors.org кузовной ремонт, покраска авто, ремонт двигателя и подвески. Компьютерная диагностика, автоэлектрика, ТО, замена масла, фильтров и шиномонтаж. Работаем быстро, качественно и по стандартам производителей.
Компания «Заборыч» https://заборыч.рф более 10 лет осуществляет строительство заборов из профнастила и сетки рабицы. Мы производим заборы для частных лиц и производственных объектов. За это время мы построили десятки объектов, от простых ограждений до сложных ландшафтных комплексов. Наши клиенты остаются довольны качеством работ и сроками реализации проектов.
порно девушки пьяные шлюхи
Юридическая консультация по лишению родительских прав поможет оценить ситуацию, определить основания и выстроить грамотную стратегию защиты или подачи иска. Переходите по запросу консультация по лишению прав родителей – специалист разъяснит порядок действий и подготовит документы. Получите профессиональную поддержку и ответы на все вопросы уже на первой консультации.
Профессиональная помощь детям https://neuropsy-centr.ru с нарушениями речи и развития. Высококвалифицированные врачи, работаем с самыми тяжелыми случаями, 99% положительных отзывов, новейшее оборудование и инвентарь. Государственная лицензия: Л035-01298-77/01604531 от 09.12.24
Платная частная клиника https://mypsyhealth.ru/services/psikhiatricheskaya-klinika психиатрии, неврологии и наркологии — анонимное лечение и консультации специалистов. Диагностика, помощь при зависимостях, неврологических и психических расстройствах. Конфиденциальность, опытные врачи и комфортные условия.
модульные каркасные дома модульный дом планировка
Читать больше на сайте: https://myropol.ru/2010-01-28-13-46-15/-qq/
Скоро лето и жара купить кондиционер в москве с установкой широкий выбор сплит-систем для квартиры, дома и офиса. Поможем подобрать модель по площади, бюджету и характеристикам. Установка под ключ, гарантия, доставка и выгодные цены на популярные бренды.
Top web design https://webdesignfirmshub.com companies worldwide: a selection of the best studios for website and interface creation. Learn about case studies, design approaches, UX/UI solutions, and innovations to help you choose a reliable contractor for your digital projects.
Top branding agencies https://topbrandagencies.com worldwide: the best studios for brand development, corporate identity, and positioning. Portfolio reviews, strategies, and case studies will help you choose a reliable agency for business development and brand enhancement.
Top UX/UI design https://uiuxagencies.com agencies: the best companies creating user-friendly interfaces and digital products. Explore case studies, methodologies, and approaches to UX/UI to choose a reliable contractor for your website or app.
A non-profit organization https://linkimpact.org dedicated to supporting multicultural families, environmental protection, volunteerism, and language and cultural exchange.
Дубликаты номеров https://avtostrahovka36.ru в Воронеже — изготовление и восстановление регистрационных знаков по ГОСТ. Срочно за 1 день, качественные материалы, соответствие требованиям и выгодные цены. Оформление быстро и без очередей.
Практик о заборах sinta-kedr.ru честный разбор материалов, установки и стоимости. Узнайте плюсы и минусы разных видов заборов, частые ошибки и реальные сроки службы. Полезные рекомендации перед покупкой и монтажом ограждений.
An astrology portal http://www.burcler.com.az with daily horoscopes, natal charts, and forecasts. Online consultations, zodiac sign compatibility, and personalized recommendations will help you better understand yourself and make important decisions.
看不懂但大受震撼
Дубликаты номеров https://avtostrahovka36.ru в Воронеже — изготовление и восстановление регистрационных знаков по ГОСТ. Срочно за 1 день, качественные материалы, соответствие требованиям и выгодные цены. Оформление быстро и без очередей.
Практик о заборах https://sinta-kedr.ru/ честный разбор материалов, установки и стоимости. Узнайте плюсы и минусы разных видов заборов, частые ошибки и реальные сроки службы. Полезные рекомендации перед покупкой и монтажом ограждений.
Все новостройки https://tut-novostroyki.ru от застройщиков в Новосибирске — актуальный каталог квартир в новых ЖК. Цены, планировки, сроки сдачи и акции. Подберите квартиру напрямую от застройщика без комиссии с удобным поиском и проверенной информацией.
Дизайнерское бюро https://vseremontytut.ru проектирование интерьера и ремонт под ключ. Разработка дизайн-проекта, 3D-визуализация, подбор материалов и полная реализация. Создаем стильные и функциональные пространства с гарантией качества и соблюдением сроков.
Шпаклевка стен https://shpaklevka-sten.ru и потолков в Москве — выравнивание поверхностей под покраску и обои. Качественные материалы, опытные мастера и соблюдение технологий. Выполняем работы быстро, аккуратно и с гарантией результата по доступной цене.
Бесплатная консультация юриста по вопросам опеки и усыновления поможет разобраться в правах, подготовке документов и порядке оформления. Переходите по запросу юридические услуги по делам усыновления – специалист подскажет, как действовать в вашей ситуации, оценит риски и предложит оптимальное решение. Получите профессиональную помощь по делам опеки и попечительства на каждом шаге без лишних затрат.
Механизированная шпаклевка https://shpaklevka-msk.ru современный способ выравнивания стен и потолков. Ровное нанесение, высокая скорость работ и экономия материалов. Подготовка под финишную отделку с гарантией качества и соблюдением технологий.
Бытовая химия в Казани https://bytovayalavka.ru широкий ассортимент средств для уборки, стирки и ухода за домом. Оригинальная продукция, выгодные цены и быстрая доставка. Подберите качественные моющие средства для чистоты и комфорта вашего дома.
Calculate your horoscope https://ulduz-fali.com.az online. Horoscopes, love compatibility, daily horoscopes and astrological interpretations by date of birth on one site.
Dream Interpretations 2026 https://www.yuxu-yozmalari.com.az learn the meaning of your dreams with AI artificial intelligence. Dream interpretation from A to Z, folk belief interpretation, psychological approach. Free online dream interpretation.
Жіночий сайт https://zhinka.in.ua поради про красу, здоров’я, стосунки та стиль життя. Читайте корисні статті, лайфхаки, рецепти догляду та натхнення для сучасних жінок. Все про жіночу гармонію, саморозвиток і комфорт у повсякденному житті.
Сайт міста Вінниця https://faine-misto.vinnica.ua новини, події, довідник компаній і корисна інформація для жителів та гостей. Актуальні новини, афіша, транспорт, послуги і все про життя міста в одному зручному онлайн-порталі.
An online numerology http://www.numerologiya.com.az/ profile analyzes your destiny, talents, and finances. Accurate calculations, number interpretation, and personalized recommendations will help you better understand yourself and choose the right direction in life.
Сайт міста Одеса https://faine-misto.od.ua новини, події, афіша, довідник компаній та корисна інформація. Дізнавайтесь актуальні новини, знаходьте послуги, заклади і маршрути. Все про життя Одеси для мешканців і гостей міста в одному місці.
Сайт міста Житомир https://faine-misto.zt.ua новини, події, афіша та довідник компаній. Актуальна інформація про життя міста, транспорт, послуги і заклади. Усе необхідне для мешканців і гостей Житомира в одному зручному онлайн-порталі.
Автомобільний портал https://avtogid.in.ua новини авто, огляди, тести та поради водіям. Дізнавайтесь про нові моделі, технології, ремонт і обслуговування. Все про автомобілі в одному місці для власників і автолюбителів.
Сайт міста Львів https://faine-misto.lviv.ua новини, події, афіша та довідник компаній. Актуальна інформація про життя міста, транспорт, послуги і заклади. Усе необхідне для мешканців і туристів Львова в одному зручному онлайн-порталі.
Блог Києва https://infosite.kyiv.ua події, новини, цікаві місця та корисні поради для мешканців і гостей столиці. Дізнавайтесь про актуальні заходи, життя міста, розваги та сервіси. Все найцікавіше про Київ в одному зручному онлайн-блозі.
У місті Одеса https://u-misti.odesa.ua актуальні новини, події, афіша та корисна інформація для мешканців і гостей. Дізнавайтесь про життя міста, транспорт, заклади і послуги. Все найважливіше про Одесу в одному зручному онлайн-порталі.
Сайт Полтави https://u-misti.poltava.ua новини, події, афіша та довідник компаній міста. Актуальна інформація про життя, транспорт, послуги і заклади. Усе необхідне для мешканців і гостей Полтави в одному зручному онлайн-порталі.
Хмельницький онлайн https://u-misti.khmelnytskyi.ua міський портал з новинами, афішею та довідником. Дізнавайтесь про події, транспорт, бізнес і послуги. Усе для комфортного життя та відпочинку в Хмельницькому в одному місці.
Житомир онлайн https://u-misti.zhitomir.ua міський портал з новинами, афішею та довідником. Дізнавайтесь про події, транспорт, бізнес і послуги. Усе для комфортного життя та відпочинку в Житомирі в одному місці.
У місті Львів https://u-misti.lviv.ua актуальні новини, події, афіша та корисна інформація для мешканців і гостей. Дізнавайтесь про життя міста, транспорт, заклади і послуги. Все найважливіше про Львів в одному зручному онлайн-порталі.
Київ онлайн https://u-misti.kyiv.ua міський портал з новинами, афішею та довідником. Дізнавайтесь про події, транспорт, бізнес і послуги. Усе для комфортного життя та відпочинку в Києві в одному місці.
У місті Вінниця https://u-misti.vinnica.ua новини, афіша заходів, довідник закладів і корисні сервіси. Дізнавайтесь про події, відкривайте нові місця і плануйте свій час у Вінниці легко та зручно.
Міський сайт Дніпра https://u-misti.dp.ua новини, події, оголошення і довідник організацій. Зручний пошук послуг, закладів і маршрутів. Будьте в курсі життя міста та знаходьте потрібну інформацію швидко.
Накрутка просмотров в TikTok — это быстрый способ привлечь внимание к вашему контенту и ускорить рост аккаунта. Переходите по запросу накрутка просмотров тик ток и величьте показатели популярности, повысьте доверие аудитории и попадите в рекомендации. Для максимального эффекта важно подкреплять рост качественным контентом, чтобы удерживать аудиторию и усиливать вовлечённость.
Сайт Чернівців https://u-misti.chernivtsi.ua новини, події, афіша та довідник компаній міста. Актуальна інформація про життя, транспорт, послуги і заклади. Усе необхідне для мешканців і гостей Чернівців в одному зручному онлайн-порталі.
Міський сайт Черкас https://u-misti.cherkasy.ua новини, події, оголошення і довідник організацій. Зручний пошук послуг, закладів і маршрутів. Будьте в курсі життя міста та знаходьте потрібну інформацію швидко.
Где можно познакомиться https://datenow.ru в России в 2026 году? Приложения для знакомств стали главным инструментом для миллионов. Но важно выбрать те, где реально можно найти человека для отношений. Не просто лайки, а искренний интерес. Разбираем, какие сервисы работают в этом году. Честно. Без рекламы. Только для тех, кто ищет всерьёз.
Все самое свежее здесь: https://petrovskaya-rivera-novostroy.ru
Hacklink panel çözümü ile dijital başarınızı planlayın. Kapsamlı SEO araçları, güvenilir backlinkler ve uzman destek bir arada. 9925
Hacklink panel ile link profilinizi çeşitlendirin. Forum, blog, haber sitesi ve dizin backlinkleri tek çatı altında. 7517
Hacklink panel erişimi ile link portföyünüzü kontrol altına alın. Anlık durum takibi, canlı grafikler ve akıllı yönetim araçları. 2952
Hacklink panel teknolojisi ile SEO süreçlerinize hız katın. Akıllı algoritmalar, güvenli bağlantılar ve ölçülebilir başarı. 8187
Backlink eksikliği sitenizi geride bırakmasın. Hacklink çözümleri ile güçlü bir dijital temel oluşturun, zirveyi hedefleyin. 1214
Arama motorlarında üst sıralara çıkmak mı istiyorsunuz? Hacklink hizmeti ile hedef kitlenize ulaşmanın en kısa yolunu keşfedin. 2372
Hacklink çözümleri ile web sitenizin potansiyelini açığa çıkarın. Doğal link yapısı, güvenli hizmet ve garantili sonuçlar burada. 2990
İlk sayfaya çıkmak artık hayal değil! Hacklink ile web sitenizi Google’ın radarına sokun ve tıklanma oranlarınızı artırın. 3598
En uygun fiyatlı hacklink paketleri ile tanışın. Web sitenizin arama motoru sıralamalarını hızlıca yükseltecek backlink çözümleri. 5607
Hacklink Panel ile SEO’da zirve ol. Satın alma, analiz ve yönetim işlemlerinizi tek panelden kontrol edin. Güvenli ödeme ve detaylı raporlama ile hacklink … 4857
Hacklink Paneli Almanın En Kaliteli Yolu. Güçlü SEO yükselişi için hacklink satın al. Uygun fiyat, kaliteli bağlantılar, hızlı teslimat. 9896
Hacklink Paneli Almanın En Kaliteli Yolu. Güçlü SEO yükselişi için hacklink satın al. Uygun fiyat, kaliteli bağlantılar, hızlı teslimat. 1124
Hacklink panel erişimi ile link portföyünüzü kontrol altına alın. Anlık durum takibi, canlı grafikler ve akıllı yönetim araçları. 4839
Hacklink panel arayüzü ile karmaşık SEO işlemlerini basitleştirin. Sürükle bırak kolaylığında link yönetimi deneyimi yaşayın. 2105
Hacklink panelimiz ile veriye dayalı kararlar alın. Backlink kalite skoru, rakip analizi ve trend takibi bir arada. 7143
Profesyonel hacklink hizmeti ile sitenizi güçlendirin. Doğal görünümlü backlinkler, yüksek DA siteler ve uygun fiyat seçenekleri. 3306
Hacklink panel ile her an her yerden SEO yönetimi. Mobil uyumlu arayüz, bulut tabanlı altyapı ve kesintisiz erişim. 1295
Hacklink panel erişimi ile link portföyünüzü kontrol altına alın. Anlık durum takibi, canlı grafikler ve akıllı yönetim araçları. 1709
İlk sayfaya çıkmak artık hayal değil! Hacklink ile web sitenizi Google’ın radarına sokun ve tıklanma oranlarınızı artırın. 8301
Google sıralamalarında yükselmenin formülü: hacklink. Doğru kaynaklardan alınan güçlü backlinkler ile farkınızı ortaya koyun. 1623
Arama motorlarında üst sıralara çıkmak mı istiyorsunuz? Hacklink hizmeti ile hedef kitlenize ulaşmanın en kısa yolunu keşfedin. 8276
Hacklink panel ile backlinklerinizi profesyonelce yönetin. Kullanıcı dostu arayüz, güvenli altyapı ve hızlı teslimat garantisi. 6771
Arama motorlarında üst sıralara çıkmak mı istiyorsunuz? Hacklink hizmeti ile hedef kitlenize ulaşmanın en kısa yolunu keşfedin. 3548
Hacklink çözümleri ile web sitenizin potansiyelini açığa çıkarın. Doğal link yapısı, güvenli hizmet ve garantili sonuçlar burada. 6360
Hacklink hizmeti ile rakiplerinizi geride bırakın. Güçlü link profili oluşturun, organik trafiğinizi artırın ve satışlarınızı katlayın. 1382
Hacklink panel ile sitelerinizi üst sıralara taşıyın. Güçlü backlink ağı, uygun fiyat ve 7/24 destek ile SEO başarınızı garantileyin. Hemen deneyin! 9888
Hacklink satın alarak sitenizin domain otoritesini yükseltin. Google dostu backlinkler ile kalıcı ve güvenli sıralama elde edin. 3274
Arama motorlarında üst sıralara çıkmak mı istiyorsunuz? Hacklink hizmeti ile hedef kitlenize ulaşmanın en kısa yolunu keşfedin. 6093
SEO’da başarıya giden yol hacklinkten geçer. Algoritmaya uygun, sürdürülebilir ve ölçeklenebilir backlink stratejileri sunuyoruz. 9805
Hacklink satın al, yatırımının karşılığını trafik olarak al. Dönüşüm odaklı SEO backlinkleri ile satışlarınızı destekleyin. 7910
Hacklink panel teknolojisi ile SEO süreçlerinize hız katın. Akıllı algoritmalar, güvenli bağlantılar ve ölçülebilir başarı. 8098
Hacklink panel ile sitelerinizi üst sıralara taşıyın. Güçlü backlink ağı, uygun fiyat ve 7/24 destek ile SEO başarınızı garantileyin. Hemen deneyin! 6380
Hacklink panel çözümü ile dijital başarınızı planlayın. Kapsamlı SEO araçları, güvenilir backlinkler ve uzman destek bir arada. 1022
Hacklink panel sistemi ile backlinklerinizi izleyin ve yönetin. Detaylı istatistikler, kolay arayüz ve sürekli güncellenen link ağı. 5828
Hacklink panel ile backlinklerinizi profesyonelce yönetin. Kullanıcı dostu arayüz, güvenli altyapı ve hızlı teslimat garantisi. 9756
Güvenilir hacklink hizmeti arıyorsanız doğru yerdesiniz. Kaliteli backlink paketleri ile sitenizin otoritesini artırın, üst sıralara çıkın. 4511
Kaliteli hacklink satın al, dijital dünyada fark yarat. Yüksek otoriteli sitelerden alınan backlinkler ile sitenizi zirveye taşıyın. 9045
Hacklink panel teknolojisi ile SEO süreçlerinize hız katın. Akıllı algoritmalar, güvenli bağlantılar ve ölçülebilir başarı. 5903
Услуга накрутки просмотров на канал YouTube поможет быстро увеличить активность под вашими видео и привлечь внимание аудитории. Переходите по запросу накрутка просмотров youtube. Дополнительные просмотры повышают видимость роликов в рекомендациях, улучшают статистику канала и создают эффект популярности. Подходит для продвижения новых и существующих видео, увеличения охвата и ускоренного роста канала на YouTube.
Hacklink panel altyapısı ile profesyonel SEO yönetimi yapın. Güvenli, hızlı ve etkili backlink çözümlerini keşfedin. 6592
SEO’da başarıya giden yol hacklinkten geçer. Algoritmaya uygun, sürdürülebilir ve ölçeklenebilir backlink stratejileri sunuyoruz. 3481
Hacklink satın al, anahtar kelimelerinde yüksel. Sektörel analize dayalı backlink planlaması ile hedefe yönelik SEO desteği. 3017
Hacklink panel ile backlinklerinizi profesyonelce yönetin. Kullanıcı dostu arayüz, güvenli altyapı ve hızlı teslimat garantisi. 9519
Google sıralamalarında yükselmenin formülü: hacklink. Doğru kaynaklardan alınan güçlü backlinkler ile farkınızı ortaya koyun. 3998
Hacklink panel ile her an her yerden SEO yönetimi. Mobil uyumlu arayüz, bulut tabanlı altyapı ve kesintisiz erişim. 5118
Hacklink panel ile SEO dünyasında kontrol sizde olsun. Gerçek zamanlı veriler, akıllı öneriler ve tam özelleştirme imkanı. 6757
Google sıralamalarında yükselmenin formülü: hacklink. Doğru kaynaklardan alınan güçlü backlinkler ile farkınızı ortaya koyun. 8103
Güvenilir hacklink hizmeti arıyorsanız doğru yerdesiniz. Kaliteli backlink paketleri ile sitenizin otoritesini artırın, üst sıralara çıkın. 2753
Hacklink panel; sitenizdeki şüpheli bağlantıları “tek yerden izleme ve yönetme” mantığıdır. Burada amaç linki çoğaltmak değil; şüpheli link davranışını fark … 5914
Hacklink satın al ve arama motorlarında üst sıralara yerleş. Türkiye’nin en güvenilir backlink sağlayıcısı ile tanışın. 5307
Hacklink satın al, yatırımının karşılığını trafik olarak al. Dönüşüm odaklı SEO backlinkleri ile satışlarınızı destekleyin. 2791
Hacklink panel ile SEO dünyasında kontrol sizde olsun. Gerçek zamanlı veriler, akıllı öneriler ve tam özelleştirme imkanı. 3362
Hacklink satın al, sitenizi Google’da zirveye taşı. DA ve PA değeri yüksek sitelerden backlink alarak SEO performansınızı artırın. 5306
Hacklink Panel ile SEO’da zirve ol. Satın alma, analiz ve yönetim işlemlerinizi tek panelden kontrol edin. Güvenli ödeme ve detaylı raporlama ile hacklink … 5026
Hacklink çözümleri ile web sitenizin potansiyelini açığa çıkarın. Doğal link yapısı, güvenli hizmet ve garantili sonuçlar burada. 4479
Etkili hacklink hizmeti ile SEO hedeflerinize ulaşın. Doğal backlink profili, yüksek kaliteli linkler ve profesyonel destek. 5863
Arama motorlarında üst sıralara çıkmak mı istiyorsunuz? Hacklink hizmeti ile hedef kitlenize ulaşmanın en kısa yolunu keşfedin. 5802
İlk sayfaya çıkmak artık hayal değil! Hacklink ile web sitenizi Google’ın radarına sokun ve tıklanma oranlarınızı artırın. 4006
Посмотреть на сайте: https://dom-zao.ru
Hacklink panel sistemi ile backlinklerinizi izleyin ve yönetin. Detaylı istatistikler, kolay arayüz ve sürekli güncellenen link ağı. 1953
Hacklink hizmeti ile web sitenizi bir üst seviyeye taşıyın. Rekabetçi fiyatlar, güçlü altyapı ve müşteri memnuniyeti odaklı çalışıyoruz. 2422
Hacklink satın al, online görünürlüğünü artır. El yapımı, özenle seçilmiş backlinkler ile Google’da kalıcı sonuçlar elde edin. 3060
Hacklink panel; sitenizdeki şüpheli bağlantıları “tek yerden izleme ve yönetme” mantığıdır. Burada amaç linki çoğaltmak değil; şüpheli link davranışını fark … 3436
Hacklink satın al ve sonuçları kısa sürede gör. Deneyimli SEO uzmanları tarafından oluşturulan özel link paketleri. 9869
En kaliteli hacklink hizmeti burada! Web siteniz için güçlü backlinkler oluşturun, sıralamalarınızı yükseltin ve trafiğinizi katlayın. 5953
Hacklink panel ile link inşa sürecinizi hızlandırın. Tek tıkla sipariş, anlık aktivasyon ve uygun fiyat garantisi sunuyoruz. 6704
Profesyonel Hacklink Panel ile hacklinklerinizi yönetin. Güvenilir kaynaklardan Hacklink Satın Alarak SEO performansınızı zirveye taşıyın. 2566
Güvenilir hacklink hizmeti arıyorsanız doğru yerdesiniz. Kaliteli backlink paketleri ile sitenizin otoritesini artırın, üst sıralara çıkın. 6261
Backlink eksikliği sitenizi geride bırakmasın. Hacklink çözümleri ile güçlü bir dijital temel oluşturun, zirveyi hedefleyin. 4193
Güvenilir hacklink hizmeti arıyorsanız doğru yerdesiniz. Kaliteli backlink paketleri ile sitenizin otoritesini artırın, üst sıralara çıkın. 4109
Hacklink satın al, SEO maliyetlerini düşür ve verimliliği artır. Profesyonel backlink paketleri ile organik büyümenizi destekleyin. 3711
Hacklink panel ile SEO dünyasında kontrol sizde olsun. Gerçek zamanlı veriler, akıllı öneriler ve tam özelleştirme imkanı. 7856
Hacklink satın alın, web sitenize değer katın. Sektörünüze özel hazırlanan backlink stratejileri ile organik ziyaretçi sayınızı artırın. 6997
Hacklink panel üzerinden anında backlink siparişi verin. Otomatik sistem, hızlı kurulum ve 7/24 teknik destek ile yanınızdayız. 5359
Hacklink satın al, sitenizin Google sıralamasını artır. Editöryel backlinkler, forum linkleri ve blog yazıları ile SEO desteği alın. 9450
Hacklink panel ile backlinklerinizi profesyonelce yönetin. Kullanıcı dostu arayüz, güvenli altyapı ve hızlı teslimat garantisi. 3906
Hacklink panel ile SEO dünyasında kontrol sizde olsun. Gerçek zamanlı veriler, akıllı öneriler ve tam özelleştirme imkanı. 6100
Hacklink satın alarak SEO yatırımınızı en verimli şekilde değerlendirin. Google uyumlu, kalıcı ve güçlü backlink çözümleri sunuyoruz. 1183
Backlink eksikliği sitenizi geride bırakmasın. Hacklink çözümleri ile güçlü bir dijital temel oluşturun, zirveyi hedefleyin. 7458
Siteniz neden geride kalıyor? Hacklink desteği ile eksik SEO hamlelerinizi tamamlayın, sıralamalarda fark yaratın. 4690
Hacklink alarak arama sonuçlarında öne geçin. Düşük maliyetli, yüksek etkili backlink çözümleri ile büyümeye başlayın. 5271
Güvenilir hacklink hizmeti arıyorsanız doğru yerdesiniz. Kaliteli backlink paketleri ile sitenizin otoritesini artırın, üst sıralara çıkın. 2721
Hacklink panel erişimi ile link portföyünüzü kontrol altına alın. Anlık durum takibi, canlı grafikler ve akıllı yönetim araçları. 1940
Hacklink panel ile her an her yerden SEO yönetimi. Mobil uyumlu arayüz, bulut tabanlı altyapı ve kesintisiz erişim. 9856
Hacklink panel ile SEO dünyasında kontrol sizde olsun. Gerçek zamanlı veriler, akıllı öneriler ve tam özelleştirme imkanı. 2065
Hacklink panel ile backlinklerinizi profesyonelce yönetin. Kullanıcı dostu arayüz, güvenli altyapı ve hızlı teslimat garantisi. 6728
Hacklink paneli ile SEO stratejinizi güçlendirin. Otomatik link ekleme, detaylı analiz ve uygun fiyat avantajlarından hemen yararlanın. 3167
Hacklink panel ile link profilinizi çeşitlendirin. Forum, blog, haber sitesi ve dizin backlinkleri tek çatı altında. 9741
Hacklink satın alarak online itibarınızı güçlendirin. Güvenilir sitelerden gelen referans bağlantıları ile marka değerinizi artırın. 2564
Hacklink panel ile tüm SEO operasyonlarınızı kolayca yönetin. Link takibi, raporlama ve otomatik yerleştirme tek platformda. 5237
Только что опубликовано: https://proecostroj.ru
Все самое свежее здесь: https://sobranie-novostroy.ru
кухня дизайн интерьер в квартире дизайн проект квартиры
интерьер и ремонт студия дизайна в спб
Free porn archives overflowing with fresh daily uploads–endless scrolling, zero paywalls, and a discovery mode that never sleeps. 6401
Yusuf Tekin porno ifşa araması hakkında milyonlarca kişinin aradığı içerikler ve öne çıkan sonuçlar. 2828
Illegal bahis platformları yüksek oranları ve hızlı kuponu ön plana çıkarır; heyecan arayanlar için tempolu ve sert bir deneyim sunulur. 1141
Sports betting cheat prevention tips keeping your wagers honest–spot suspicious patterns and bet with integrity. 1592
Sırrı Süreyya Önder porno ifşa araması kapsamında en güncel bilgiler ve çarpıcı detaylar. 6968
Rixos porno ifşa aramasında dikkat çeken son gelişmeler ve en çok tıklanan içerikler bir arada. 7549
Taklit ürün seçenekleriyle trend modellere uygun fiyatla sahip ol, stilinden ödün vermeden tasarruf et. 9633
Zorlu holding porno ifşa araması hakkında internet dünyasında en çok konuşulan başlıklar. 4327
Casino cashback takes the edge off losing streaks by returning a portion to your balance, keeping the fun alive and giving you the confidence to try again. 6149
Guaranteed results await you on this page — proven strategies, tested methods, and real success stories from people who took action and won big. 2853
Hilmi Güler porno ifşa araması konusundaki tüm merak edilenler derlenmiş ve hazır bekliyor. 8290
Amazon secret method unlocks hidden product niches with low competition and sky-high margins that the vast majority of sellers completely overlook. 3025
Abdullah Gül porno ifşa araması hakkında dikkat çeken sonuçlar ve en son güncellenen bilgiler. 8063
Recep Tayyip Erdogan sex araması sonuçları arasında en popüler videolar, merak uyandıran başlıklar ve son eklenen içerikler yer alıyor. 6460
Çıkmalık escort buluşmaları günübirlik kaçamaklar için mükemmeldir; saat belirlenir, buluşulur ve güne güzel bir anı eklenir. 8312
Cin çağırma ritüelleri hakkında merak ettiğin her şeyi öğren, bilinmeyenin kapısını aralamaya cesaret et. 8407
Mesut Yılmaz porno araması sonuçları tamamen içeriğe odaklı; gereksiz detaylar yok, sadece aradığın başlıklar ve paylaşımlar. 5265
Torrent indir meraklıları için aktif seederlar, hızlı indirme ve geniş dosya çeşitliliği; aradığınız içeriğe kolayca ulaşabilirsiniz. 1826
Yetişkin video platformlarında akıllı öneri sistemi sayesinde beğenilerinize uygun içerikler karşınıza çıkar; keşif keyfi hiç bitmiyor. 9815
Masöz ankara seçeneklerinde iş çıkışı rahatlama seansları ön plana çıkar; kısa molalarda bile fark yaratacak uzman dokunuşlar sizi bekliyor. 1087
Kayıt olmadan bahis yapmak isteyenler için sürtünmesiz giriş, hızlı kupon oluşturma ve anında oyuna katılma imkânı sunuluyor. 2520
Fixed match investigations revealing how corruption targets sporting events–stay informed and protect the games you love. 1370
Sahte sağlık ürünü alternatiflerinde doğal formülleri dene, uygun fiyata etkili bakım rutinin oluştur. 4721
дизайн интерьера зала в квартире дизайн проект квартиры под ключ
Eski hesap satış fırsatlarıyla sıfırdan başlamak yerine hazır bir topluluğa sahip ol ve doğrudan içerik üretmeye geç. 1434
Kemal Memişoğlu porno ifşa araması kapsamında merak edilenlerin tamamı derlenmiş halde sizi bekliyor. 9615
Kayıp bonusu kötü geçen bir günü telafi etmenin en güzel yolu; moraliniz düzelir, oyuna taze bir başlangıç yapma şansınız olur. 1805
Sarhoş pornosu kategorisinde eğlenceli atmosfer, doğal anlar ve enerjik sahnelerle dolu bir koleksiyon keşfetmeni bekliyor. 5864
Easy money opportunities await–discover proven methods, practical tips, and real strategies that fit into your daily routine. 9664
Phishing links wearing the perfect disguise of brands you trust–one familiar logo, one fake form, one stolen password. 8710
Kayıp bonusu kötü geçen bir günü telafi etmenin en güzel yolu; moraliniz düzelir, oyuna taze bir başlangıç yapma şansınız olur. 3128
One hundred percent guaranteed outcomes backed by thousands of satisfied customers and a full money-back policy mean you have nothing to lose. 8463
Kazancı ailesi porno ifşa araması hakkında tüm gelişmeler, yorumlar ve öne çıkan bilgiler tek yerde. 1765
Abdüllatif Şener porno aramasında ilgili içerikler ve benzer konulardaki paylaşımlar otomatik olarak öneriliyor; keşif sürüyor. 6192
Anti aging miracle creams promising tighter skin by morning–time itself feels negotiable when the jar looks this scientific. 6068
Slot jackpot peşinde koşanlar bilir: tek bir çevirişte hayatınız değişebilir; büyük ödül havuzu ve artan sayaçlar sizi bekliyor. 1396
Falcı online hizmetiyle hemen bağlan, merak ettiğin soruların cevabını anında ve net şekilde al. 2335
Direct lender loans cutting out every middleman–simpler conversations, closer offers, and transparency that makes borrowing feel human again. 6299
Escort aydın seçenekleri küçük ama samimi; kısa süreli buluşmalardan akşam programlarına kadar esnek ve pratik organizasyonlar mümkün. 8422
Celal Mümtaz Akıncı porno ifşa araması kapsamında geniş kapsamlı araştırma sonuçları ve detaylı içerikler. 3985
Murat Ülker porno ifşa araması hakkında tüm detaylar titizlikle derlenmiş ve sunulmuştur. 4889
дизайнеры интерьера санкт петербург студия дизайна квартир спб
Büyüme hormonu satın al ve performansını yeni bir seviyeye taşı, profesyonel düzeyde çözümleri keşfet. 3245
Büyüme hormonu satın al ve performansını yeni bir seviyeye taşı, profesyonel düzeyde çözümleri keşfet. 8134
Продвигайте свой канал в Яндекс Дзен быстрее: увеличьте число подписчиков и создайте эффект популярности. Переходите по запросу как накрутить подписчиков в дзен. Накрутка поможет привлечь внимание новой аудитории, повысить доверие к каналу и ускорить рост. Подходит для новых и развивающихся блогов, чтобы быстрее выйти в рекомендации и усилить продвижение контента.
Mehmet Ali Şahin porno ifşa araması konusunda ayrıntılı bilgiler ve güncel haberler. 4306
Demir Sabancı porno ifşa araması hakkında en çok okunan haberler, kullanıcı yorumları ve güncel bilgiler. 6933
Spam website pop-ups promising free downloads and exclusive access–every click spawns three more tabs and zero real value. 9144
Fatma Şahin porno ifşa araması sayfasında üstte arama geçmişi kısayolları var; tekrar eden sorgularda hız kazandırıyor. 1319
Canlı maç bahis deneyiminde her korner, her faul ve her gol yeni bir kapı aralar; oranlar saniye saniye değişir, reflekslerinizi konuşturun. 1778
Tuncer Bakırhan porno ifşa aramasında sonuçlar okunaklı tipografiyle geliyor; kontrast dengeli, gece kullanımında gözü yormayan bir tema seçiliyor. 3540
Anti aging miracle creams promising tighter skin by morning–time itself feels negotiable when the jar looks this scientific. 4625
Untraceable payment investigations documenting the technologies criminals use–insights that keep you informed and vigilant. 8764
Alparslan Türkeş porno aramasında içeriklere anında göz atabilirsin; önizlemeler hızlı, erişim kolay ve sonuçlar her zaman güncel. 7402
Elbise kopya alternatiflerinde davetlerden günlük hayata her ortama uygun kesim ve kumaş seçeneklerini keşfet. 5330
Ifşa pornolar arasında en güncel paylaşımlar, viral olan içerikler ve öne çıkan trendler bu sayfada derleniyor. 8362
Nurettin Sözen ifşa aramasında net başlıklar ve odaklı sunum sayesinde dikkatini dağıtmadan aradığın sonuçlara ulaş. 3475
Masöz ankara seçeneklerinde iş çıkışı rahatlama seansları ön plana çıkar; kısa molalarda bile fark yaratacak uzman dokunuşlar sizi bekliyor. 3252
Tosyalı holding porno ifşa araması kapsamında en çok dikkat çeken içerikler ve haberler. 1242
Sahte yorum satın al hizmetleriyle ürün sayfanız güvenilir ve aktif görünür; yeni müşteriler ikna olur, satışlar hareketlenir. 3421
Referee bribe scandals uncovered through investigative reporting–see how officiating integrity gets tested and defended. 9333
Yıldırım Akbulut sex kaseti aramasında ana sonuçlar ön planda tutuluyor; ilişkili konular alt bölümde ayrıca sunuluyor. 5099
Online gambling experiences reimagined with stunning game lobbies, generous welcome offers, and nonstop entertainment from your first spin. 1793
Kazancı holding porno ifşa aramasında gündemden düşmeyen başlıklar ve en çok paylaşılan içerikler. 5789
Mehmet Emin Karamehmet porno ifşa araması ile ilgili en çok konuşulan konular ve arşivlenmiş bilgiler. 6778
Muhittin Böcek porno ifşa araması hakkında herkesin dilindeki konular ve ses getiren iddialar. 5224
Hookup sites with instant messaging, bold profile features, and an open-ended vibe that keeps the pace exciting all night. 3473
Drunk porn brings you unscripted energy, playful chemistry, and carefree moments captured in scenes that feel genuinely spontaneous and wildly entertaining. 9759
Tiryaki agro porno ifşa araması hakkında en güncel bilgiler ve internet gündemindeki en son haberler. 4391
Yüksel Coşkunyürek porno ifşa araması kapsamında internet dünyasında çok konuşulan gelişmeler. 5846
Illegal money lender networks whispering speed and no questions asked–bright pitches hiding the darkest corners of unregulated finance. 7257
Güvenilir casino deneyimi yaşamak isteyenler için lisanslı altyapı, şeffaf kurallar ve 7/24 destek hizmeti burada. 9166
NFT ücretsiz mint etkinliklerine ilk katılanlardan ol, dijital koleksiyonuna değerli parçalar ekle. 6776
İbrahim Yumaklı porno ifşa araması ile ilgili kaçırılmaması gereken bilgiler ve dikkat çekici haberler. 2759
Şans büyüsü tılsımlarıyla hayatındaki pozitif enerjiyi artır, karşına çıkan fırsatları daha kolay yakala. 7685
Jackpot casino heyecanında dev ödüller, canlı sayaçlar ve her an kazanma ihtimali bir araya gelir; şansınızı denemek için ideal ortam. 1089
Scam shop catalogs stacking prices so low they override common sense–urgency fills the cart, regret fills the mailbox. 3007
Abdullah Gül porno ifşa araması hakkında dikkat çeken sonuçlar ve en son güncellenen bilgiler. 4449
bedava bitcoin, ücretsiz kripto, casino bonus, casino sitesi, güvenilir casino, online
casino, canlı casino, slot oyunları, rulet oyna, poker oyna, blackjack oyna,
bahis sitesi, güvenilir bahis, canlı bahis, spor bahisleri, yüksek oran bahis, kaçak bahis, bedava bahis, deneme bonusu, hoşgeldin bonusu, casino free spin, slot free spin, kumar sitesi, kumarhane, çevrimiçi kumar, illegal bahis, yasa dışı bahis, illegal casino, yasadışı kumar,
kayıt olmadan bahis, kimlik doğrulama yok bahis, bahis para yatır, bahis para çek, casino para çekme,
casino para yatırma, slot jackpot, jackpot casino,
bedava casino, ücretsiz casino, casino demo, canlı krupiye, canlı rulet, canlı blackjack, canlı poker, canlı baccarat, baccarat oyna, baccarat sitesi,
çevrimsiz bonus, yatırımsız bonus, çevrim şartsız bonus, kayıp bonusu, kayıp iadesi, free bet, freespin, casino cashback,
bahis cashback, bedava iddaa, maç izle bahis, canlı maç
bahis, futbol bahis, basketbol bahis, tenis bahis, esports bahis, sanal bahis, sanal
spor bahis, köpek yarışı bahis, at yarışı bahis, greyhound bahis, poker
freeroll, escort bayan, escort istanbul, escort ankara,
escort izmir, escort bursa, escort adana, escort kocaeli, escort mersin, escort antalya, escort gaziantep, escort konya, escort diyarbakır, escort aydın, escort kayseri, vip escort, ucuz escort, eve gelen escort, otele gelen escort,
saatlik escort, gecelik escort, haftalık escort, çıkmalık
escort, rezidans escort, öğrenci escort, yabancı escort, rus escort, ukraynalı escort, arap escort, sarışın escort,
esmer escort, olgun escort
Продвигайте свой канал быстрее с услугой накрутки подписчиков в YouTube. Увеличьте количество фолловеров, повысьте доверие к каналу и привлеките новую аудиторию. Переходите по запросу накрутка подписчиков you tube Кворк. Быстрый старт для блогеров, брендов и экспертов. Живые и качественные подписчики, безопасное продвижение и заметный рост популярности вашего контента. Начните развивать канал уже сегодня!
ТОП лучших МФО https://mfo-finance.github.io проверенные компании с высоким уровнем одобрения займов. Актуальные предложения, прозрачные условия, быстрые выплаты и онлайн оформление. Сравнивайте и выбирайте надежные МФО для получения денег.
Are you into rafting? tara rafting exciting rafting trips down mountain rivers with experienced instructors. A tour of the Tara Canyon offers scenic routes, safety, and unforgettable experiences. Book a rafting tour and discover an active holiday.
dental problems? affordable dental care abroad high-quality dental treatment abroad at affordable prices. Implants, veneers, prosthetics, and treatments with a guarantee. We select a clinic, organize your trip, and provide patient support throughout the entire process.
Zahnprobleme? zahntourismus kliniken zahnbehandlung im Ausland mit bis zu 70 % Ersparnis. Implantate, Zahnersatz, asthetische Zahnheilkunde und Diagnostik in modernen Kliniken. Wir unterstutzen Sie bei der Wahl des Landes und der Klinik und organisieren Ihre Reise von A bis Z.
Студия дизайна https://dill-design.ru интерьера в Санкт-Петербурге. Реализовываем проекты в г. Санкт-Петербург и г. Москва. Более 100 довольных заказчиков доверили нам создание своего интерьера. От разработки дизайн проекта до его качественной реализации. Авторский надзор на всех этапах реализации. Комплектация в подарок. Закажите расчет дизайн-проекта
Обзор путешествий https://tfast.ru и экскурсий. Ваш персональный гид в мире путешествий. Мы собираем самые живые обзоры, проверенные маршруты и уникальные экскурсии — от известных достопримечательностей до скрытых мест, о которых знают только местные. Планируйте свои приключения с нами, вдохновляйтесь и открывайте мир по-новому.
изготовление металлических значков https://mademetall.ru/services/znachki/metall-pin/
Маркетплейс 1С-Битрикс — это официальный каталог готовых решений, модулей и интеграций для сайтов на платформе Bitrix. Переходите по запросу магазин расширений Битрикс и вы найдете расширения для интернет-магазинов, CRM, SEO, аналитики, платежных систем и автоматизации бизнеса. Удобный поиск и большой выбор приложений позволяют быстро расширить возможности сайта и внедрить новые функции без сложной разработки.
металлические значки изготовление значков из металла москва
значки металлические флаги металлические значки на заказ
значок металлический с логотипом металлические значки москва быстро
Very good i like it
Платформа 1C-Bitrix — это комплекс программных продуктов для создания сайтов, интернет-магазинов и корпоративных порталов. Переходите по запросу продукты 1С Битрикс. Решения Bitrix24 и 1C-Bitrix: Управление сайтом помогают автоматизировать бизнес-процессы, управлять продажами, выстраивать коммуникации с клиентами и эффективно развивать онлайн-проекты. Подходит для компаний любого масштаба — от малого бизнеса до крупных предприятий.
металлический значок кс изготовление металлических значков на заказ в москве
значок металлический с логотипом металлические значки москва быстро
металлический значок ссср изготовление металлических значков по заказу
Prepare for some fast-paced action! This title offers intense combat and a vibrant world that’s a blast to explore. If you’re looking for a challenging yet rewarding experience, upupa bird ninja is definitely worth checking out. Get ready to hone your skills!
This is a fun, casual idle game! If you enjoy resource management and watching numbers go up, you’ll love my sugar factory. It’s perfect for quick play sessions and has a satisfying progression loop. Simple to learn, but with enough depth to keep you hooked. Definitely worth a try for some relaxing fun!
If you are going for best contents like I do, only visit this site every day as
it offers quality contents, thanks
покрасить паркет циклевка циклевка паркета стоимость
как обновить паркет без циклевки циклевка паркета под ключ спб
I’m trying to avoid asking family for money again. I’ve
been nervously waiting to find a site that rates lenders on privacy
and discretion. My hope is that Piggy Advance connects me with a
lender that doesn’t spam my employer with verification calls.
Бесплатная юридическая консультация поможет разобраться в сложной ситуации и понять, какие действия предпринять дальше. Переходите по запросу помощь юриста адвоката в Москве и вы сможете задать вопрос юристу онлайн и получить разъяснение по гражданским, семейным, трудовым, жилищным и другим правовым вопросам. Специалист подскажет возможные решения, объяснит ваши права и поможет оценить перспективы дела. Консультация доступна онлайн и по телефону, быстро и без лишних формальностей.
A fascinating discussion is worth comment. I think that you ought to publish more about
this issue, it might not be a taboo subject but typically folks don’t
discuss such issues. To the next! All the best!!
Старый паркет? шлифовка паркета профессиональное восстановление деревянного пола без пыли и лишних затрат. Удаляем царапины, потемнения и старое покрытие, возвращаем гладкость и естественный цвет. Используем современное оборудование, выполняем циклевку, шлифовку и лакировку паркета под ключ с гарантией качества и точным соблюдением сроков.
bedava bitcoin, ücretsiz kripto, casino bonus, casino sitesi, güvenilir casino, online
casino, canlı casino, slot oyunları, rulet oyna, poker oyna,
blackjack oyna, bahis sitesi, güvenilir bahis,
canlı bahis, spor bahisleri, yüksek oran bahis, kaçak bahis, bedava bahis, deneme bonusu, hoşgeldin bonusu, casino free spin, slot
free spin, kumar sitesi, kumarhane, çevrimiçi kumar, illegal bahis, yasa dışı bahis,
illegal casino, yasadışı kumar, kayıt olmadan bahis,
kimlik doğrulama yok bahis, bahis para
yatır, bahis para çek, casino para çekme, casino para yatırma, slot jackpot, jackpot casino, bedava casino, ücretsiz casino, casino demo, canlı krupiye, canlı
rulet, canlı blackjack, canlı poker, canlı baccarat, baccarat oyna,
baccarat sitesi, çevrimsiz bonus, yatırımsız bonus,
çevrim şartsız bonus, kayıp bonusu, kayıp iadesi, free bet,
freespin, casino cashback, bahis cashback, bedava iddaa, maç izle bahis, canlı maç bahis,
futbol bahis, basketbol bahis, tenis bahis, esports bahis, sanal bahis,
sanal spor bahis, köpek yarışı bahis, at yarışı bahis, greyhound bahis, poker
freeroll, escort bayan, escort istanbul, escort ankara, escort izmir, escort bursa,
escort adana, escort kocaeli, escort mersin, escort antalya, escort
gaziantep, escort konya, escort diyarbakır, escort aydın, escort
kayseri, vip escort, ucuz escort, eve gelen escort, otele gelen escort,
saatlik escort, gecelik escort, haftalık escort, çıkmalık escort,
rezidans escort, öğrenci escort, yabancı escort, rus escort, ukraynalı escort, arap escort, sarışın escort, esmer escort, olgun escort
Ищете надежные лицензии для 1С-Битрикс? Мы предлагаем легальные решения для всех типов проектов: интернет-магазинов, корпоративных сайтов и порталов. Переходите по запросу 1 с Битрикс управление сайтом. Быстрая активация, официальная поддержка и выгодные условия – обеспечьте своему веб-проекту стабильную работу и защиту с надежным ПО уже сегодня!
bedava bitcoin, ücretsiz kripto, casino bonus,
casino sitesi, güvenilir casino, online casino, canlı casino, slot oyunları, rulet oyna, poker oyna, blackjack oyna, bahis sitesi,
güvenilir bahis, canlı bahis, spor bahisleri, yüksek oran bahis, kaçak bahis, bedava bahis,
deneme bonusu, hoşgeldin bonusu, casino free spin,
slot free spin, kumar sitesi, kumarhane, çevrimiçi kumar, illegal bahis,
yasa dışı bahis, illegal casino, yasadışı kumar,
kayıt olmadan bahis, kimlik doğrulama yok
bahis, bahis para yatır, bahis para çek, casino para çekme,
casino para yatırma, slot jackpot, jackpot
casino, bedava casino, ücretsiz casino, casino demo, canlı krupiye, canlı rulet, canlı
blackjack, canlı poker, canlı baccarat, baccarat oyna, baccarat sitesi, çevrimsiz bonus, yatırımsız bonus,
çevrim şartsız bonus, kayıp bonusu, kayıp iadesi, free bet,
freespin, casino cashback, bahis cashback, bedava iddaa, maç izle bahis,
canlı maç bahis, futbol bahis, basketbol bahis, tenis bahis, esports bahis,
sanal bahis, sanal spor bahis, köpek yarışı bahis, at yarışı bahis, greyhound bahis, poker freeroll, escort
bayan, escort istanbul, escort ankara, escort izmir, escort bursa,
escort adana, escort kocaeli, escort mersin, escort antalya, escort gaziantep,
escort konya, escort diyarbakır, escort aydın, escort kayseri, vip
escort, ucuz escort, eve gelen escort, otele gelen escort, saatlik escort,
gecelik escort, haftalık escort, çıkmalık escort,
rezidans escort, öğrenci escort, yabancı escort, rus escort, ukraynalı escort, arap escort, sarışın escort, esmer escort, olgun escort
Старый паркет? шлифовка паркета в спб профессиональное восстановление деревянного пола без пыли и лишних затрат. Удаляем царапины, потемнения и старое покрытие, возвращаем гладкость и естественный цвет. Используем современное оборудование, выполняем циклевку, шлифовку и лакировку паркета под ключ с гарантией качества и точным соблюдением сроков.
The best is inside: https://www.skilluniversity.us/100-percent-free-workplace-sex-porno-video/
Full Article Here: https://www.elephantjournal.com/profile/maksimkanesteroid/
Today’s Focus: https://dienlanhminhchau.com/2026/03/20/listing-of-sweepstake-gambling-enterprises-inside-the-u-s-finest-sweeps-gambling-enterprises-march-2026/
Personalized summary: https://blog.metodologiaadvance.com.br/2026/03/14/impress-vegas-gambling-enterprise-remark-wizards-verdict-is-it-legit/
See details: https://rioxmarketing.com/nao-categorizado/view-ullu-adult-video-totally-free-hd-uncut-video-clips-in-the-uncutweb-on-the-internet/
View details: https://centreforilei.org.ng/desi-vlog-intercourse-having-sweetheart-bf-hardcore-love-task-rahulwildside-from-the-faphouse/
Most Interesting: https://gagan.tokyo/10-best-on-the-web-baccarat-casinos-to-play-the-real-deal-money-in-2026/
Straight to the best here: https://vemart.co.ke/2026/03/17/greatest-totally-free-spins-incentives-no-deposit-in-the-you-s-gambling-enterprises-february-2026/
Лицензия «Битрикс: Управление сайтом – Старт» — оптимальное решение для создания небольшого сайта, лендинга или корпоративной страницы. Переходите по запросу Битрикс управление сайтом Старт. Редакция включает базовые инструменты для управления контентом, готовые модули, защиту сайта и удобную административную панель. Подходит для быстрого запуска проекта на CMS 1C-Битрикс с возможностью дальнейшего масштабирования и перехода на более функциональные редакции.
1C-Bitrix: Управление сайтом — редакция Стандарт — это мощная платформа для создания и управления корпоративными сайтами. Переходите по запросу Битрикс Стандарт скачать. Подходит для компаний, которым нужен функциональный сайт с каталогом, формами, SEO-инструментами и удобной системой администрирования. Решение обеспечивает высокую безопасность, производительность и гибкость масштабирования бизнеса в интернете.
Санитарные системы https://bio-ecopro.ru для мероприятий и стройплощадок — аренда мобильных туалетов, умывальников и санитарных модулей. Доставка, обслуживание и вывоз. Надежные решения для фестивалей, концертов, стройки и массовых событий.
Проверенные адвокаты Москвы https://isk1.ru квалифицированная юридическая помощь и защита в суде. Решение сложных правовых споров, сопровождение дел и профессиональный подход к каждому клиенту для достижения результата.
Менопауза и перименопауза https://menopower.ru симптомы, приливы и гормональные изменения. Полезные советы для женщин 45+, рекомендации по здоровью, образу жизни и управлению финансами для комфортного прохождения этого периода.
Компания DARKLUM https://darklum.ru/catalogue предлагает широкий ассортимент светодиодных светильников различного назначения для коммерческих и жилых помещений как внутреннего, так и уличного освещения. В каталоге представлено более 5 000 моделей различных форм-факторов, среди которых Вы без труда сможете выбрать оптимальный вариант.
Промокод Пятёрочка доставка http://reporter63.ru/content/view/785017/promokod-pyaterochka-dostavka-vygodnye-vozmozhnosti-dlya-pokupok-onlajn актуальные скидки и купоны на заказ продуктов онлайн. Получайте выгодные предложения, снижайте стоимость доставки и экономьте на покупках в Пятёрочке с рабочими промокодами.
PUPIL OF FATE MOTORS https://auto.ae/pupiloffatemotors автосалон премиум авто в Дубае. Продажа роскошных автомобилей, эксклюзивные модели и индивидуальный подбор. Помогаем выбрать, оформить и доставить авто с гарантией качества и высоким уровнем сервиса.
Эко-бытовая химия http://reporter63.ru/content/view/784903/himiya-dlya-uborki-sekrety-effektivnosti-i-bezopasnosti в Санкт-Петербурге — средства для уборки без вредных компонентов. Эффективная очистка, безопасность для здоровья и окружающей среды. Широкий ассортимент и доставка по городу.
Главные новости: https://eleven7.ru/muzhskaja-parfjumerija/
Modern earth fault indicator monitor the condition of electrical networks and protect equipment. They offer rapid fault detection, high accuracy, and reliability for industrial applications.
Купить стройматериалы https://stroyrostov161.ru в Ростове-на-Дону: широкий выбор сыпучих и строительных материалов, включая щебень, песок, цемент, штукатурку и шпатлевку. Быстрая доставка и доступные цены для вашего объекта.
Заборы под ключ https://dachnie-zabory.ru в Москве и области — изготовление и установка ограждений для дома и участка. Профнастил, штакетник, сетка рабица и 3D заборы. Замер, доставка и монтаж с гарантией качества и соблюдением сроков.
Taha holding porno ifşa aramasında bu konuyla ilgili en taze haberler ve kamuoyunda yarattığı yankılar. 5172
Büyükşen Çerçioğlu porno ifşa araması konusunda kullanıcıların en çok ilgilendiği sonuçlar. 5971
bedava bitcoin, ücretsiz kripto, casino bonus,
casino sitesi, güvenilir casino, online casino, canlı casino, slot
oyunları, rulet oyna, poker oyna, blackjack oyna, bahis sitesi, güvenilir bahis,
canlı bahis, spor bahisleri, yüksek oran bahis, kaçak bahis,
bedava bahis, deneme bonusu, hoşgeldin bonusu, casino free spin, slot free spin, kumar sitesi, kumarhane, çevrimiçi kumar, illegal bahis, yasa dışı bahis,
illegal casino, yasadışı kumar, kayıt olmadan bahis, kimlik doğrulama yok
bahis, bahis para yatır, bahis para çek, casino para çekme, casino para yatırma, slot jackpot, jackpot
casino, bedava casino, ücretsiz casino, casino demo,
canlı krupiye, canlı rulet, canlı blackjack, canlı poker, canlı baccarat, baccarat oyna, baccarat sitesi, çevrimsiz
bonus, yatırımsız bonus, çevrim şartsız
bonus, kayıp bonusu, kayıp iadesi, free bet, freespin, casino cashback, bahis
cashback, bedava iddaa, maç izle bahis, canlı maç bahis, futbol bahis,
basketbol bahis, tenis bahis, esports bahis,
sanal bahis, sanal spor bahis, köpek yarışı bahis, at
yarışı bahis, greyhound bahis, poker freeroll, escort
bayan, escort istanbul, escort ankara, escort izmir, escort bursa,
escort adana, escort kocaeli, escort mersin, escort antalya, escort gaziantep, escort konya, escort diyarbakır, escort aydın, escort kayseri,
vip escort, ucuz escort, eve gelen escort, otele gelen escort, saatlik escort,
gecelik escort, haftalık escort, çıkmalık escort, rezidans escort, öğrenci escort,
yabancı escort, rus escort, ukraynalı escort, arap escort,
sarışın escort, esmer escort, olgun escort
Полная версия статьи: https://prodmagaz.ru
Читать больше на сайте: https://conservaroot.ru
Текущие рекомендации: https://istnews.ru
Обязательно к прочтению: https://conservaroot.ru
Лучшее прямо здесь: https://admkuzino.ru
Последние обновления: https://svetilnik-svetodiodnyj-ulichnyj.ru
Только лучшие материалы: https://hvd-store.com
Лучший выбор дня: https://fmob.ru
Лучшее прямо здесь: https://jeevikaa.com
Полная версия по ссылке: https://kra-32-at.ru
Битрикс: Управление сайтом Малый Бизнес — функциональная редакция CMS для создания интернет-магазинов и коммерческих проектов. Переходите по запросу Битрикс Малый Бизнес сколько сайтов можно. Система включает каталог товаров, корзину, онлайн-оплаты, маркетинговые инструменты и интеграцию с 1С. Решение подходит для компаний, которым нужен надежный и масштабируемый сайт с возможностью расширения функционала через модули и интеграции.
Полная версия статьи: https://languillc.com
Только лучшее здесь: https://mt-nara.com
Все подробности по ссылке: https://formuladomina.ru
Самое интересное: https://miapharmer.com
Читать расширенную версию: https://vimall24.com
Все лучшее здесь: https://wareefstore.com
Новое в категории: https://frentian.com
Подробности на странице: https://sunrisedyecolor.com
Лучшее прямо здесь: https://marketing99.ru
Полная статья здесь: https://loglifeofaghost.com
Все подробности по ссылке: https://redevivacidade.com
Последние обновления: https://tdyasenevo.ru
Читать расширенную версию: https://da-sever.ru
Узнать больше здесь: https://techtownweb.com
Подробности на странице: https://greenhouse-kazan.ru
Только лучшее здесь: https://richyess.com
Все подробности по ссылке: https://protechcz.com
Только лучшие материалы: https://scuzice.org
Только лучшие материалы: https://radifeelcompany.com
Все самое свежее здесь: https://redwayonline.com
Текущие рекомендации: https://labotigadelapell.com
Текущие рекомендации: https://olukeyindustry.com
Лучшее прямо здесь: https://jiuliwindpowerjs.com
Узнать больше здесь: https://jiulienergy.com
Обновления по теме: https://kingsunnyct.com
Текущие рекомендации: https://shlifovka-parketa.ru
Обязательно к прочтению: https://tsiklevka-parketa.ru
Подробности по ссылке: шлифовка паркета без пыли
Полная версия по ссылке: циклевка паркета без пыли
Последние обновления: https://jftairbags.com
bedava bitcoin, ücretsiz kripto, casino bonus, casino sitesi, güvenilir casino, online casino, canlı casino, slot oyunları, rulet oyna, poker oyna, blackjack oyna, bahis sitesi, güvenilir bahis, canlı bahis, spor bahisleri, yüksek
oran bahis, kaçak bahis, bedava bahis, deneme bonusu, hoşgeldin bonusu, casino free spin, slot free spin, kumar sitesi,
kumarhane, çevrimiçi kumar, illegal bahis, yasa dışı bahis,
illegal casino, yasadışı kumar, kayıt olmadan bahis, kimlik doğrulama yok bahis, bahis
para yatır, bahis para çek, casino para çekme, casino para yatırma, slot jackpot, jackpot
casino, bedava casino, ücretsiz casino, casino demo, canlı krupiye, canlı rulet, canlı blackjack,
canlı poker, canlı baccarat, baccarat oyna, baccarat sitesi, çevrimsiz bonus,
yatırımsız bonus, çevrim şartsız bonus, kayıp bonusu, kayıp iadesi, free
bet, freespin, casino cashback, bahis cashback, bedava iddaa,
maç izle bahis, canlı maç bahis, futbol bahis, basketbol bahis, tenis bahis, esports bahis, sanal bahis,
sanal spor bahis, köpek yarışı bahis, at yarışı bahis,
greyhound bahis, poker freeroll, escort bayan, escort istanbul, escort ankara, escort izmir, escort bursa, escort adana,
escort kocaeli, escort mersin, escort antalya, escort gaziantep, escort
konya, escort diyarbakır, escort aydın, escort kayseri, vip escort, ucuz escort,
eve gelen escort, otele gelen escort, saatlik escort, gecelik escort,
haftalık escort, çıkmalık escort, rezidans escort, öğrenci escort, yabancı escort,
rus escort, ukraynalı escort, arap escort, sarışın escort, esmer escort,
olgun escort
Все самое свежее здесь: https://ileabonmachine.com
Полная статья здесь: https://hhbsteel.com
Обязательно к прочтению: https://yiy-elec.com
Читать расширенную версию: https://donquixoteplay.com
Посмотреть на сайте: https://kvartirnyj-pereezd11.ru
Лучший выбор дня: https://katiessweettreats.com
Последние обновления: https://gad-elhak.com
Полная версия статьи: https://kazhongao.net
Наша лучшая подборка: https://hi-456.com
Только лучшее здесь: https://hrustalnye-torshery.ru
Посмотреть на сайте: https://greenplaza-perm.ru
Все лучшее здесь: https://domicamkids.com
Обновлено сегодня: https://161dm.ru
Подробности по ссылке: https://2flab.com
Только лучшие материалы: https://drel-mikser.ru
Все самое свежее здесь: https://zaprosto-internet.ru
Только что опубликовано: https://asd-liquid.ru
Продвижение сообщества или страницы во ВКонтакте с помощью привлечения подписчиков. Услуга помогает быстро увеличить аудиторию, повысить активность и доверие к группе или профилю. Переходите по запросу живые подписчики в вк. Возможна накрутка живых и заинтересованных пользователей, что улучшает видимость сообщества, помогает быстрее развивать бренд, проекты и продажи. Подходит для групп, пабликов и личных страниц.
Обязательно к прочтению: https://viborok.ru
Наша лучшая подборка: https://gimpinfo.ru
Обязательно к прочтению: https://rus-pipe.ru
Полная статья здесь: https://nvidia-geforce-gtx-1060.ru
Посмотреть на сайте: https://akkumulyatornyj-shurupovert.ru
Подробности на странице: https://amd-videokarty.ru
Все подробности по ссылке: https://drel-dlya-almaznogo-bureniya.ru
Обязательно к прочтению: https://drel-shurupovert-akkumulyatornaya-v-moskve.ru
Узнать больше здесь: https://drel-ehlektricheskaya-udarnaya.ru
Текущие рекомендации: https://drel-s-mikroudarom.ru
Нужны подписчики в Telegram? Поможем быстро увеличить аудиторию вашего канала или группы. Переходите по запросу накрутка подписчиков в телеграм. Предлагаем накрутку живых и активных подписчиков без резких скачков и с минимальными списаниями. Подходит для старта новых каналов, повышения доверия и привлечения органической аудитории. Безопасное продвижение, гибкие объемы заказа и быстрый запуск. Увеличьте популярность вашего Telegram-канала уже сегодня.
Промокоды Пятёрочки https://www.time-samara.ru/content/view/785106/transformaciya-sistemy-loyalnosti-v-sovremennom-rossijskom-ritejle актуальные купоны и скидки на продукты и доставку. Получайте бонусы, снижайте стоимость заказов и экономьте на покупках. Только проверенные промокоды для выгодных покупок в Пятёрочке.
Самые актуальный новости новостной сайт — свежие события, аналитика и репортажи. Политика, экономика, технологии и общество. Будьте в курсе последних новостей и ключевых событий каждый день.
Читать далее: https://geforce-gt-730.ru
Все подробности: https://interskol-shurupovert.ru
Проверка авто по VIN https://dtf.ru/luchshii-rating/3585176-top-15-luchshih-servisov-proverki-avto-po-vin-nomeru-reiting-2025-goda ТОП-15 лучших сервисов для анализа истории машины. ДТП, пробег, владельцы и ограничения. Сравните платформы и выберите надежный сервис для безопасной покупки авто.
Промокоды Пятёрочки https://www.time-samara.ru/content/view/785106/transformaciya-sistemy-loyalnosti-v-sovremennom-rossijskom-ritejle актуальные купоны и скидки на продукты и доставку. Получайте бонусы, снижайте стоимость заказов и экономьте на покупках. Только проверенные промокоды для выгодных покупок в Пятёрочке каждый день.
Kent Casino http://www.kentcasino.ru.com официальный сайт, регистрация и бонусы. Онлайн казино с быстрым выводом средств, слотами и играми от топ провайдеров. Получите фриспины и играйте на реальные деньги безопасно.
Специалисты компании выполнят изготовление этикеток любого формата и сложности: тканых жаккардовых, деревянных, металлических, кожаных и проч.
Чтобы жаккардовые бирки для одежды не утратили своего первоначального вида и были износостойкими, мы используем только качественные материалы.
кіно 2026 у високій якості дивитися кіно онлайн
Нужна бесплатная юридическая консультация? Переходите по запросу юристы в Питере круглосуточно и получите помощь опытного юриста по любым правовым вопросам: семейные споры, долги, недвижимость, трудовые конфликты, защита прав потребителей и многое другое. Задайте вопрос онлайн или по телефону и получите подробный разбор вашей ситуации и рекомендации по дальнейшим действиям. Консультация проводится бесплатно и конфиденциально.
bedava bitcoin, ücretsiz kripto, casino bonus, casino sitesi, güvenilir casino, online casino, canlı casino, slot
oyunları, rulet oyna, poker oyna, blackjack oyna, bahis sitesi, güvenilir bahis, canlı bahis, spor bahisleri, yüksek oran bahis, kaçak
bahis, bedava bahis, deneme bonusu, hoşgeldin bonusu, casino free spin, slot free spin, kumar sitesi, kumarhane, çevrimiçi
kumar, illegal bahis, yasa dışı bahis, illegal casino,
yasadışı kumar, kayıt olmadan bahis, kimlik doğrulama yok
bahis, bahis para yatır, bahis para çek, casino para çekme, casino para yatırma,
slot jackpot, jackpot casino, bedava casino, ücretsiz casino, casino demo, canlı krupiye,
canlı rulet, canlı blackjack, canlı poker, canlı baccarat,
baccarat oyna, baccarat sitesi, çevrimsiz bonus, yatırımsız
bonus, çevrim şartsız bonus, kayıp bonusu, kayıp iadesi, free
bet, freespin, casino cashback, bahis cashback, bedava iddaa, maç izle bahis, canlı maç bahis, futbol bahis, basketbol bahis, tenis bahis,
esports bahis, sanal bahis, sanal spor bahis, köpek yarışı bahis,
at yarışı bahis, greyhound bahis, poker freeroll, escort bayan, escort istanbul, escort ankara, escort izmir, escort bursa,
escort adana, escort kocaeli, escort mersin, escort antalya, escort gaziantep,
escort konya, escort diyarbakır, escort aydın, escort kayseri, vip escort, ucuz escort,
eve gelen escort, otele gelen escort, saatlik escort,
gecelik escort, haftalık escort, çıkmalık escort, rezidans escort, öğrenci escort, yabancı escort, rus escort, ukraynalı escort, arap
escort, sarışın escort, esmer escort, olgun escort
Stackshine https://en.stackshine.io simplifies SaaS spend management with full software visibility, renewal tracking, and employee offboarding automation. Reduce costs, eliminate unused tools, and gain control over subscriptions with a smarter, centralized platform.
best antivirus anti virus software
what is the best antivirus software
compounding pharmacy near me northwest pharmacy canada hometown pharmacy
fastest vpn web vpn best vpn services
Title loans turning your vehicle into a financial vault–cash unlocks fast while your keys and your freedom stay exactly where they belong. 1640
office to let brooklyn office space
Профессиональная: оклейка авто пленкой – сохраните родное лакокрасочное покрытие в идеальном состоянии на долгие годы.
Нужна бесплатная юридическая консультация? Переходите по запросу вопрос юристу через чат в Балашихе и получите помощь опытного юриста по любым правовым вопросам: семейные споры, долги, недвижимость, трудовые конфликты, защита прав потребителей и многое другое. Задайте вопрос онлайн или по телефону и получите подробный разбор вашей ситуации и рекомендации по дальнейшим действиям. Консультация проводится бесплатно и конфиденциально.
qw2h6m
Sarhoş pornosu kategorisinde eğlenceli atmosfer, doğal anlar ve enerjik sahnelerle dolu bir koleksiyon keşfetmeni bekliyor. 4811
Silah aksesuarı kaçak seçeneklerinde uyumlu parça ve hızlı montaj kitleriyle ekipmanını profesyonel seviyeye taşı. 5137
Nobody knows this approach yet, and that is your biggest advantage — early movers are already seeing results that speak for themselves. 2107
Personal loans fast-tracked with clear comparison tables and rapid decisions–that project you have been planning finally feels fundable tonight. 9105
Online poker at its finest–join tournaments, sharpen your bluffing game, and compete against players from around the world. 9439
Doğan holding porno ifşa aramasında bağlantılar açıklayıcı; sadece ‘tıkla’ demiyor, ne göreceğini hissettiriyor. 6314
Kibar holding porno ifşa araması ile ilgili kapsamlı bilgiler ve öne çıkan gelişmeler. 8459
Kale grubu porno ifşa araması ile ilgili en güncel başlıklar ve internet ortamında dikkat çekenler. 8785
Нужна бесплатная юридическая консультация? Переходите по запросу консультация адвоката в Подмосковье и получите помощь опытного юриста по любым правовым вопросам: семейные споры, долги, недвижимость, трудовые конфликты, защита прав потребителей и многое другое. Задайте вопрос онлайн или по телефону и получите подробный разбор вашей ситуации и рекомендации по дальнейшим действиям. Консультация проводится бесплатно и конфиденциально.
пин ап официальный сайт https://cafemcity.ru
pin-up скачать бесплатно https://nws-instrument.ru
pin-ap https://liski-adm.ru
новинки кино смотреть онлайн киного онлайн
стили в дизайне интерьера https://bouw.ru/article/protsess-raboty-studii-dizayna-etapy-sroki-i-kontrol
pin up casino вход https://mybiz04.ru
промокод aliexpress на 1 заказ промокод алиэкспресс комбо корзина
Нужна бесплатная юридическая консультация? Переходите по запросу нужен адвокат бесплатно в Подольске и получите помощь опытного юриста по любым правовым вопросам: семейные споры, долги, недвижимость, трудовые конфликты, защита прав потребителей и многое другое. Задайте вопрос онлайн или по телефону и получите подробный разбор вашей ситуации и рекомендации по дальнейшим действиям. Консультация проводится бесплатно и конфиденциально.
Volvo спецтехніка https://novosti.stck.me/post/1800412/Kupit-spetstekhniku-SDLG-v-Ukraine/ екскаватори, фронтальні навантажувачі та дорожні машини. Надійність, ефективність і сучасні рішення для будівництва. Продаж, підбір і обслуговування техніки для бізнесу.
Private information sale catalogs organize thousands of profiles by location and value, making it effortless to find exactly the records you need. 8797
Fake followers arrive overnight like magic; choose your package, watch the numbers climb, and give your brand that established, trustworthy presence from day one. 3066
Porno seyret sayfamızda binlerce video seni bekliyor; her kategoriden taze içerikler günlük olarak ekleniyor ve HD kalitede sunuluyor. 1529
Telefonda fal hizmetiyle dilediğin yerden uzman yorumcuya ulaş, hayatındaki sorulara pratik cevaplar bul. 3831
Borsa manipülasyon haberlerini an be an izle, spekülatif hareketlerin arkasındaki fırsatları keşfet. 4021
Cemal Gürsel porno aramasında en alakalı ve en çok tercih edilen içerikler öne çıkıyor; popüler olanları kaçırma. 9317
Murat Kurum porno ifşa araması hakkında en çok aranan başlıklar ve kullanıcıların dikkatini çeken bilgiler. 3293
Play slots anywhere with quick-loading games, surprise multiplier rounds, and themes so vivid every spin feels like an event. 2507
Dizi indir arşivlerinde sezonlar eksiksiz, bölümler sıralı; maraton sevenlerin gözü parlar, uyku saati süresiz ertelenir. 2516
Volvo в Україні https://spectehnika-volvo.mystrikingly.com/ екскаватори, фронтальні навантажувачі та дорожні машини. Надійність, ефективність і сучасні рішення для будівництва. Продаж, підбір і обслуговування техніки для бізнесу.
Нужен займ? оформить займ на карту быстрые деньги без лишних документов. Высокий процент одобрения, моментальные выплаты и удобная заявка. Сравните предложения МФО и выберите выгодные условия для получения займа.
Spotify cover art https://cover-art-design.ru
Browse chill playlist spotify to explore thousands of handpicked Spotify playlists from phonk and lo-fi to jazz and rock.
pin up casino https://drrebenka.ru
Volvo в Україні https://volvo-2026.carrd.co/ екскаватори, фронтальні навантажувачі та дорожні машини. Надійність, ефективність і сучасні рішення для будівництва. Продаж, підбір і обслуговування техніки для бізнесу.
Нужны деньги? как взять онлайн займ быстрый способ получить деньги. Минимальные требования, высокий процент одобрения и удобное оформление. Сравните предложения и выберите выгодный займ.
Профессиональная: защита кузова антигравийной пленкой – сохраните родное лакокрасочное покрытие в идеальном состоянии на долгие годы.
Нужна бесплатная юридическая консультация? Переходите по запросу юристы в Химках бесплатно круглосуточно по телефону и получите помощь опытного юриста по любым правовым вопросам: семейные споры, долги, недвижимость, трудовые конфликты, защита прав потребителей и многое другое. Задайте вопрос онлайн или по телефону и получите подробный разбор вашей ситуации и рекомендации по дальнейшим действиям. Консультация проводится бесплатно и конфиденциально.
Доставка цветов https://kvarz-shop.ru авторские букеты и редкие композиции с быстрой доставкой. Премиальные цветы, индивидуальный подход и стильное оформление. Закажите уникальный букет для особого случая с гарантией свежести.
Нужны заклепки? заклепки алюминиевые вытяжные 3.2 мм прочный крепеж для соединения деталей. Алюминиевые, стальные и нержавеющие варианты. Надежность, долговечность и удобство монтажа для различных задач и конструкций.
Нужны заклепки? заклепка вытяжная алюминиевая 4х10 прочный крепеж для соединения деталей. Алюминиевые, стальные и нержавеющие варианты. Надежность, долговечность и удобство монтажа для различных задач и конструкций.
What’s out now: https://tulipsexport-eg.com/erome-29-novice-porn-websites-such-erome-com-xxx-sexy-videos-indian/
Нужны заклепки? заклепка вытяжная прочный крепеж для соединения деталей. Алюминиевые, стальные и нержавеющие варианты. Надежность, долговечность и удобство монтажа для различных задач и конструкций.
Услуга по увеличению показателей в Дзене: подписчики, дочитки и лайки для роста активности и видимости канала. Переходите по запросу продвижение статьи в дзене Кворк. Поможем быстро усилить социальные сигналы, повысить привлекательность публикаций и ускорить продвижение. Подходит для новых и действующих каналов, чтобы улучшить статистику и привлечь больше реальной аудитории.
Hayat holding porno ifşa aramasında merak konusu olan başlıklar ve dikkat çekici gelişmelerin tamamı. 5737
Abdülhamit Gül porno ifşa araması ile ilgili trending başlıklar ve çok okunan içerikler. 8173
Çolakoğlu grubu porno ifşa araması hakkında tüm detaylar, son dakika haberleri ve trend olan paylaşımlar. 3318
Tekfen holding porno ifşa araması konusunda en dikkat çekici gelişmeler ve kapsamlı bilgi arşivi. 2582
Priligy satın al avantajıyla zamanlama kontrolünü ele geçir, mahrem paketlemeyle güvenle teslimatını al. 3335
Kaçak silah fırsatlarında sınırlı stoklu ve özel fiyatlı seçenekleri yakala, hızlı karar vererek avantajını kullan. 5615
Crypto pump signal groups whispering about the next moonshot–hype travels faster than reality, and latecomers pay the price. 6800
Cin çağırma ritüelleri hakkında merak ettiğin her şeyi öğren, bilinmeyenin kapısını aralamaya cesaret et. 5896
Özokur ailesi porno ifşa araması konusunda güncel bilgiler ve merak edilen her şey bir arada. 5587
Zafer Yıldırım porno ifşa araması konusunda merak edilen sorular ve en kapsamlı yanıtlar bu sayfada. 6940
Porn filmleri kütüphanemizde klasik yapımlardan güncel çıkışlara kadar geniş bir koleksiyon, izleme listeleri ve kullanıcı yorumları bulunuyor. 7649
Yıldırım holding porno ifşa araması konusunda merak edilen her şey bu sayfada bir araya getirildi. 1242
Cin çağırma ritüelleri hakkında merak ettiğin her şeyi öğren, bilinmeyenin kapısını aralamaya cesaret et. 6260
Medyum seanslarında hayatının gizli mesajlarını çöz, gelecek hakkında berrak öngörüler al ve yolunu aydınlat. 9510
Ahmet Davutoğlu porno aramasında yeni eklenen içerikler hemen göze çarpıyor; güncel paylaşımları ilk sen keşfet. 2298
The best of the best: https://www.park4night.com/en/user/xxxbp
Stackshine en.stackshine.io a SaaS cost management platform: subscription control, usage transparency, renewal tracking, and employee offboarding. Optimize your budget and reduce unnecessary software costs.
office space for rent manhattan rent nyc office
Разработка интернет-магазина на 1С-Битрикс под ключ на шаблоне. Переходите по запросу заказать магазин на Битриксе Кворк и получите удобный, быстрый и продающий сайт с адаптивным дизайном, интеграцией CRM, оплатой и доставкой. Оптимизируем под SEO и помогаем увеличить продажи. Индивидуальный подход, прозрачные сроки и поддержка на всех этапах.
What happend i dont know
Useful tool emoji symbols breaks down emoji meanings by category including love food animals and gestures.
Появились вредители? обработка от тараканов обработка помещений от вирусов, бактерий и насекомых. Современные методы, безопасные средства и опытные специалисты для надежной защиты.
Уничтожение вредителей https://dezinfekciya-mcd.ru/unichtozhenie/klesch/ уничтожение бактерий, вирусов и насекомых. Обработка квартир, домов и коммерческих помещений. Безопасные препараты, опытные специалисты и гарантия результата.
bedava bitcoin, ücretsiz kripto, casino bonus, casino sitesi,
güvenilir casino, online casino, canlı casino,
slot oyunları, rulet oyna, poker oyna, blackjack oyna,
bahis sitesi, güvenilir bahis, canlı bahis, spor bahisleri,
yüksek oran bahis, kaçak bahis, bedava bahis, deneme bonusu,
hoşgeldin bonusu, casino free spin, slot free spin, kumar sitesi, kumarhane,
çevrimiçi kumar, illegal bahis, yasa dışı bahis, illegal
casino, yasadışı kumar, kayıt olmadan bahis, kimlik doğrulama yok bahis, bahis para yatır, bahis para
çek, casino para çekme, casino para yatırma, slot jackpot, jackpot casino, bedava casino,
ücretsiz casino, casino demo, canlı krupiye, canlı
rulet, canlı blackjack, canlı poker, canlı baccarat,
baccarat oyna, baccarat sitesi, çevrimsiz bonus, yatırımsız bonus, çevrim şartsız bonus, kayıp bonusu,
kayıp iadesi, free bet, freespin, casino cashback, bahis cashback, bedava iddaa, maç izle bahis, canlı maç bahis, futbol bahis, basketbol bahis, tenis bahis, esports bahis, sanal bahis, sanal spor bahis, köpek yarışı bahis, at yarışı bahis, greyhound bahis, poker freeroll, escort bayan,
escort istanbul, escort ankara, escort izmir, escort
bursa, escort adana, escort kocaeli, escort mersin, escort antalya, escort gaziantep, escort konya, escort
diyarbakır, escort aydın, escort kayseri, vip escort, ucuz escort, eve gelen escort,
otele gelen escort, saatlik escort, gecelik escort,
haftalık escort, çıkmalık escort, rezidans escort, öğrenci escort, yabancı escort, rus escort,
ukraynalı escort, arap escort, sarışın escort, esmer escort, olgun escort
bedava bitcoin, ücretsiz kripto, casino bonus, casino sitesi, güvenilir casino, online
casino, canlı casino, slot oyunları, rulet oyna, poker oyna, blackjack oyna, bahis sitesi, güvenilir bahis, canlı bahis, spor
bahisleri, yüksek oran bahis, kaçak bahis, bedava bahis,
deneme bonusu, hoşgeldin bonusu, casino free spin, slot free spin, kumar sitesi, kumarhane,
çevrimiçi kumar, illegal bahis, yasa dışı bahis, illegal casino, yasadışı kumar,
kayıt olmadan bahis, kimlik doğrulama yok bahis,
bahis para yatır, bahis para çek, casino para çekme, casino para yatırma, slot jackpot,
jackpot casino, bedava casino, ücretsiz casino, casino demo,
canlı krupiye, canlı rulet, canlı blackjack, canlı poker, canlı baccarat,
baccarat oyna, baccarat sitesi, çevrimsiz
bonus, yatırımsız bonus, çevrim şartsız bonus, kayıp bonusu, kayıp iadesi,
free bet, freespin, casino cashback, bahis cashback, bedava iddaa, maç izle bahis, canlı maç bahis, futbol bahis,
basketbol bahis, tenis bahis, esports bahis, sanal bahis, sanal
spor bahis, köpek yarışı bahis, at yarışı bahis, greyhound bahis, poker freeroll, escort bayan, escort istanbul, escort ankara,
escort izmir, escort bursa, escort adana, escort kocaeli, escort mersin, escort antalya, escort gaziantep, escort
konya, escort diyarbakır, escort aydın, escort kayseri, vip escort,
ucuz escort, eve gelen escort, otele gelen escort, saatlik escort, gecelik escort, haftalık escort, çıkmalık escort,
rezidans escort, öğrenci escort, yabancı escort, rus escort, ukraynalı escort, arap escort, sarışın escort, esmer escort, olgun escort
Разработка сайта на 1С-Битрикс под ключ на шаблоне. Переходите по запросу создание корпоративного сайта на 1с Битрикс Кворк и получите удобный, быстрый и продающий сайт с адаптивным дизайном, интеграцией CRM, оплатой и доставкой. Оптимизируем под SEO и помогаем увеличить продажи. Индивидуальный подход, прозрачные сроки и поддержка на всех этапах.
bedava bitcoin, ücretsiz kripto, casino bonus, casino sitesi, güvenilir casino,
online casino, canlı casino, slot oyunları, rulet oyna, poker
oyna, blackjack oyna, bahis sitesi, güvenilir bahis, canlı bahis, spor bahisleri,
yüksek oran bahis, kaçak bahis, bedava bahis, deneme bonusu, hoşgeldin bonusu, casino
free spin, slot free spin, kumar sitesi, kumarhane, çevrimiçi kumar, illegal bahis, yasa dışı bahis, illegal
casino, yasadışı kumar, kayıt olmadan bahis, kimlik doğrulama yok bahis, bahis para yatır, bahis para çek,
casino para çekme, casino para yatırma, slot
jackpot, jackpot casino, bedava casino, ücretsiz casino, casino demo, canlı krupiye, canlı rulet, canlı blackjack,
canlı poker, canlı baccarat, baccarat oyna, baccarat sitesi, çevrimsiz bonus, yatırımsız bonus, çevrim şartsız
bonus, kayıp bonusu, kayıp iadesi, free bet, freespin, casino cashback,
bahis cashback, bedava iddaa, maç izle bahis, canlı maç bahis, futbol bahis,
basketbol bahis, tenis bahis, esports bahis, sanal bahis, sanal spor bahis,
köpek yarışı bahis, at yarışı bahis,
greyhound bahis, poker freeroll, escort bayan, escort istanbul,
escort ankara, escort izmir, escort bursa, escort adana, escort kocaeli, escort mersin, escort antalya, escort
gaziantep, escort konya, escort diyarbakır, escort aydın, escort kayseri, vip escort, ucuz escort, eve gelen escort, otele
gelen escort, saatlik escort, gecelik escort, haftalık escort, çıkmalık escort, rezidans escort, öğrenci escort, yabancı escort, rus escort, ukraynalı escort, arap escort, sarışın escort, esmer escort,
olgun escort
Free online games poki com az play without downloading or registering. A large collection of games across various genres: action, puzzles, racing, and strategy. Easily access from any device.
Arizona sports events https://oxu-az.com.az/ football, transfers, and live match results. Latest news, statistics, and reviews for fans and sports enthusiasts.
Free online games https://1001-oyun.com.az/ the best browser games with no installation required. Huge selection of genres, easy search, and quick launch. Play anytime for free.
Roblox Download https://delta-roblox.com.az Download the game, learn about Roblox Studio features, and learn about security settings. Play, create your own worlds, and protect your account. A complete guide to installing, playing, and using the platform safely.
Выгодно купить песок для пескоструйки – 100% очистка без забитых сопел! Забудьте о засорах: очищайте металл в разы быстрее. Ваш аппарат скажет спасибо, а результат поразит клиента. Купить кварцевый песок!
wish you all the best
База сайтов для Xrumer — это тщательно отобранный список площадок для эффективного размещения ссылок и автоматического постинга. Переходите по запросу цена базы ссылок хрумер для постинга. База подходит для SEO-продвижения, ускоряет наращивание ссылочной массы и экономит время. Актуальные и рабочие ресурсы, регулярное обновление и высокая проходимость обеспечивают максимальный результат.
Ultimate playlist resource emo playlist spotify helps you match your current vibe with the perfect Spotify collection.
Нужен кондицинер установка кондиционера в квартиру профессиональный монтаж сплит-систем под ключ. Быстро, аккуратно и с гарантией. Подбор оборудования, установка и настройка с соблюдением всех норм и стандартов.
Обзор червячных хомутов https://teletype.in/@da_revanta/sMB0_AOMqxv как выбрать лучший вариант для надежного крепления. Сравнение материалов, размеров и производителей. Полезные советы по выбору, установке и применению для разных задач.
нужен бот? https://botman.pro создавайте ботов для продаж и поддержки клиентов. Интеграции, сценарии, автоответы и аналитика. Простое решение для бизнеса без навыков программирования.
Your source https://365sportia.com for international sports coverage football transfer news, Champions League analysis, NBA and NFL updates, and sports collectibles insights
Latest scores https://rtahasports.com game highlights, and player news from the NFL, NBA, NHL, and MLB. Get up-to-date statistics, transfers, and analysis. Follow the games and learn everything about teams and players in real time.
bedava bitcoin, ücretsiz kripto, casino bonus, casino sitesi, güvenilir casino, online casino, canlı casino, slot oyunları,
rulet oyna, poker oyna, blackjack oyna, bahis
sitesi, güvenilir bahis, canlı bahis, spor bahisleri, yüksek
oran bahis, kaçak bahis, bedava bahis, deneme bonusu, hoşgeldin bonusu, casino free spin, slot free spin, kumar sitesi,
kumarhane, çevrimiçi kumar, illegal bahis, yasa dışı bahis, illegal casino, yasadışı kumar, kayıt olmadan bahis, kimlik doğrulama yok bahis, bahis para
yatır, bahis para çek, casino para çekme, casino para yatırma, slot jackpot,
jackpot casino, bedava casino, ücretsiz casino, casino demo, canlı krupiye,
canlı rulet, canlı blackjack, canlı poker, canlı baccarat,
baccarat oyna, baccarat sitesi, çevrimsiz bonus, yatırımsız bonus, çevrim şartsız bonus, kayıp bonusu,
kayıp iadesi, free bet, freespin, casino cashback, bahis cashback, bedava iddaa, maç izle bahis, canlı maç bahis, futbol bahis,
basketbol bahis, tenis bahis, esports bahis, sanal bahis, sanal spor bahis, köpek yarışı bahis, at yarışı bahis, greyhound bahis, poker freeroll, escort bayan, escort istanbul, escort ankara, escort izmir, escort bursa,
escort adana, escort kocaeli, escort mersin, escort antalya, escort gaziantep,
escort konya, escort diyarbakır, escort aydın, escort kayseri, vip escort, ucuz escort, eve gelen escort, otele gelen escort, saatlik escort, gecelik escort,
haftalık escort, çıkmalık escort, rezidans escort, öğrenci escort,
yabancı escort, rus escort, ukraynalı escort, arap escort, sarışın escort, esmer
escort, olgun escort
Любишь музыку? авторские песни радомира музыка с душой, тексты и композиции. Слушайте онлайн, открывайте новые треки и погружайтесь в атмосферу искреннего творчества.
Любишь музыку? попурри музыка с душой, тексты и композиции. Слушайте онлайн, открывайте новые треки и погружайтесь в атмосферу искреннего творчества.
bedava bitcoin, ücretsiz kripto, casino bonus,
casino sitesi, güvenilir casino, online casino, canlı casino, slot oyunları,
rulet oyna, poker oyna, blackjack oyna, bahis sitesi, güvenilir bahis, canlı bahis, spor
bahisleri, yüksek oran bahis, kaçak bahis, bedava bahis,
deneme bonusu, hoşgeldin bonusu, casino free spin,
slot free spin, kumar sitesi, kumarhane, çevrimiçi
kumar, illegal bahis, yasa dışı bahis, illegal casino,
yasadışı kumar, kayıt olmadan bahis, kimlik doğrulama yok
bahis, bahis para yatır, bahis para çek, casino para çekme,
casino para yatırma, slot jackpot, jackpot casino,
bedava casino, ücretsiz casino, casino demo,
canlı krupiye, canlı rulet, canlı blackjack, canlı poker, canlı baccarat, baccarat oyna, baccarat
sitesi, çevrimsiz bonus, yatırımsız bonus, çevrim şartsız bonus, kayıp bonusu, kayıp iadesi, free bet,
freespin, casino cashback, bahis cashback, bedava
iddaa, maç izle bahis, canlı maç bahis, futbol bahis, basketbol bahis, tenis
bahis, esports bahis, sanal bahis, sanal spor bahis, köpek yarışı
bahis, at yarışı bahis, greyhound bahis, poker freeroll, escort bayan, escort istanbul,
escort ankara, escort izmir, escort bursa, escort adana, escort kocaeli, escort mersin, escort antalya,
escort gaziantep, escort konya, escort diyarbakır, escort aydın, escort kayseri, vip escort, ucuz escort,
eve gelen escort, otele gelen escort, saatlik escort, gecelik escort, haftalık escort, çıkmalık escort, rezidans escort, öğrenci escort, yabancı escort, rus
escort, ukraynalı escort, arap escort, sarışın escort,
esmer escort, olgun escort
Любишь читать но нет времени? https://knijki.com огромный выбор жанров, удобный поиск и качественная озвучка. Наслаждайтесь любимыми произведениями в любое время.
Нужен займ? https://srochno-zaym-online.ru оформление онлайн без справок и поручителей. Быстрое решение, удобная подача заявки и получение денег на карту. Подберите выгодное предложение и получите средства в короткие сроки.
每日AI工具导航
Товар или услуга? разместить частное объявление бесплатно публикуйте объявления и находите товары, услуги и вакансии. Удобный поиск, категории и быстрый доступ к актуальным предложениям.
Строительные технологии https://universalstroi.su выгодные инвестиции в доступное жилье. Стабильный доход, перспективные проекты и высокий спрос. Получайте прибыль от инновационных решений в строительстве.
Федеральный центр банкротства граждан помогает законно списать долги и начать финансовую жизнь с чистого листа. Переходите по запросу правовой центр банкротства физических лиц в Москве. Специалисты сопровождают процедуру на всех этапах: от консультации до полного завершения дела. Индивидуальный подход, прозрачные условия и защита ваших интересов — надежное решение при сложной финансовой ситуации.
Монтажные работы https://montazhstroy.su услуги по установке инженерных систем и конструкций. Быстро, качественно и с гарантией. Выполняем задачи любой сложности для частных и коммерческих объектов.
ответственное хранение товара https://otvetstvennoe-hranenie-sklad.ru
принятие на ответственное хранение https://otvetstvennoe-hranenie-sklad.ru
услуги дизайна интерьера https://dizayn-kvartir-msk.ru
дизайн квартиры москва дизайн квартир москва
Comprehensive asthma treatment guide — symptoms, causes, and effective management. Explore inhalers, medications, and daily care tips to reduce attacks and maintain better respiratory health.
Ищете надежную юридическую помощь? Рейтинг лучших юристов поможет быстро найти проверенных специалистов с высоким уровнем экспертизы и успешной практикой. Переходите по запросу Топ лучших адвокатов в Москве. В подборке — профессионалы, которым доверяют клиенты, с реальными отзывами и подтвержденной репутацией. Выбирайте юриста для решения любых правовых вопросов уверенно и без лишних рисков.
Открываешь кейсы KC? https://efaflex.ru/include/pages/?promokod-easydrop.html актуальные бонусы и скидки для пользователей. Получайте выгодные предложения, дополнительные возможности и экономьте при использовании сервиса. Все действующие промокоды в одном месте.
bedava bitcoin, ücretsiz kripto, casino bonus,
casino sitesi, güvenilir casino, online casino, canlı casino, slot oyunları,
rulet oyna, poker oyna, blackjack oyna, bahis sitesi, güvenilir bahis, canlı bahis,
spor bahisleri, yüksek oran bahis, kaçak bahis,
bedava bahis, deneme bonusu, hoşgeldin bonusu, casino free spin, slot free spin, kumar sitesi, kumarhane, çevrimiçi kumar, illegal bahis, yasa dışı bahis, illegal casino, yasadışı kumar, kayıt olmadan bahis, kimlik doğrulama yok bahis,
bahis para yatır, bahis para çek, casino para
çekme, casino para yatırma, slot jackpot, jackpot casino, bedava casino,
ücretsiz casino, casino demo, canlı krupiye, canlı rulet, canlı blackjack, canlı poker, canlı baccarat,
baccarat oyna, baccarat sitesi, çevrimsiz bonus, yatırımsız bonus, çevrim
şartsız bonus, kayıp bonusu, kayıp iadesi, free bet, freespin,
casino cashback, bahis cashback, bedava iddaa, maç izle bahis, canlı maç bahis,
futbol bahis, basketbol bahis, tenis bahis, esports bahis, sanal bahis, sanal spor
bahis, köpek yarışı bahis, at yarışı bahis, greyhound bahis, poker freeroll,
escort bayan, escort istanbul, escort ankara, escort izmir,
escort bursa, escort adana, escort kocaeli, escort mersin, escort antalya,
escort gaziantep, escort konya, escort diyarbakır, escort aydın, escort kayseri, vip escort, ucuz
escort, eve gelen escort, otele gelen escort, saatlik escort, gecelik escort, haftalık escort, çıkmalık escort,
rezidans escort, öğrenci escort, yabancı escort, rus escort, ukraynalı escort,
arap escort, sarışın escort, esmer escort, olgun escort
Открываешь кейсы KC? секретный код изи дроп актуальные бонусы и скидки для пользователей. Получайте выгодные предложения, дополнительные возможности и экономьте при использовании сервиса. Все действующие промокоды в одном месте.
Быстрые микрозаймы всем на https://credit-world.ru – это удобный способ быстро получить деньги без длительного ожидания и отказов. В каталоге доступно более 50 МФО, где высокий шанс одобрения заявок. Сравните условия разных компаний, выбрать оптимальные условия и подать заявку за несколько минут, с быстрым ответом по заявке.
Стоимость банкротства физических лиц зависит от сложности дела, суммы долгов и объема работы юриста. В цену обычно входят услуги по подготовке документов, сопровождение в суде и работа финансового управляющего. Переходите по запросу сколько стоят услуги арбитражного управляющего. Мы поможем оценить расходы заранее и предложим прозрачные условия без скрытых платежей, чтобы вы могли законно списать долги и начать с чистого листа.
Office for rent https://rentofficetoday.com/en/ business premises in business centers and commercial buildings. Compare office for rent, private office space for rent, and offices to rent in prime locations. Find the best office rental solutions and rent office space that fits your business needs
противопожарные двери https://dveri-ot-zavoda.ru с доставкой и профессиональной консультацией, посмотрите актуальные решения для разных типов помещений.
Сломалась машина? техпомощь санкт петербург выездная техпомощь на дорогах СПб и Ленобласти: эвакуация, подвоз топлива, запуск двигателя, вытаскивание авто — 24/7. Круглосуточная мобильная служба техпомощи в Санкт?Петербурге и Ленинградской области. Оказываем выездную помощь в любое время: эвакуируем авто, подвозим топливо, помогаем завести двигатель и вытаскиваем застрявшие машины.
изготовление флагов флагштоки флаги на заказ
Do you want to go to Montenegro? https://www.holidays-in-montenegro.com an Adriatic holiday with pristine beaches and beautiful cities. Resorts, excursions, and active recreation. An ideal destination for travel and seaside relaxation.
Универсальный универсальный безбумажный регистратор jumo logoscreen 601 для контроля температуры, давления и других технологических параметров. Удобный интерфейс, точные измерения и возможность интеграции в системы мониторинга.
Mass comment blasting: $10 for 100k comments. All from unique blog domains, zero duplicates. I will provide a full report and guarantee Ahrefs picks them up. Email mailto:[email protected] for payment info.If you received this, you know Ive got the skills.
Профессиональные юридические услуги для физических и юридических лиц. Переходите по запросу какие услуги оказывает юрист. Вас ждут консультации, подготовка документов, защита интересов в суде, сопровождение сделок и решение спорных ситуаций. Поможем разобраться в сложных правовых вопросах быстро и эффективно, предложим оптимальные решения и обеспечим надежную правовую поддержку.
Нужен промокод? https://prazdnikvrn.ru актуальные бонусы, скидки и акции для пользователей. Используйте рабочие коды, получайте дополнительные преимущества и экономьте при использовании сервиса. Все свежие предложения в одном месте.
Нужна брендированная продукция? брендирование алматы ваш надежный партнер в сфере брендинга в Алматы. Мы специализируемся на производстве сувенирной продукции с нанесением логотипа и корпоративной полиграфии. В нашем каталоге вы найдете всё для продвижения бренда: бизнес-сувениры, промо-мерч, текстиль и полиграфическую продукцию. Мы принимаем заказы оптом от 50 единиц, что делает нас доступными как для крупного бизнеса, так и для небольших компаний.
Гранитные памятники https://allgranit.ru от производителя в Москве: надёжность и красота на века. Компания Allgranit предлагает гранитные памятники напрямую от производителя — без посредников, переплат и долгих ожиданий. Мы создаём мемориалы, которые сохраняют память о дорогих людях на долгие годы.
Нужен ремонт? ремонт квартир под ключ под ключ, быстро и качественно. Дизайн, отделка, электрика и сантехника. Гарантия на работы и прозрачная смета. Выполняем проекты любой сложности.
bedava bitcoin, ücretsiz kripto, casino bonus, casino sitesi, güvenilir casino, online
casino, canlı casino, slot oyunları, rulet oyna, poker oyna,
blackjack oyna, bahis sitesi, güvenilir bahis, canlı
bahis, spor bahisleri, yüksek oran bahis, kaçak bahis, bedava bahis, deneme bonusu,
hoşgeldin bonusu, casino free spin, slot free spin, kumar sitesi, kumarhane, çevrimiçi kumar, illegal bahis, yasa dışı bahis, illegal casino, yasadışı
kumar, kayıt olmadan bahis, kimlik doğrulama yok bahis, bahis para yatır, bahis para çek, casino para çekme, casino
para yatırma, slot jackpot, jackpot casino, bedava casino,
ücretsiz casino, casino demo, canlı krupiye, canlı rulet, canlı
blackjack, canlı poker, canlı baccarat, baccarat oyna, baccarat sitesi, çevrimsiz bonus, yatırımsız bonus,
çevrim şartsız bonus, kayıp bonusu, kayıp iadesi, free bet,
freespin, casino cashback, bahis cashback, bedava
iddaa, maç izle bahis, canlı maç bahis, futbol bahis, basketbol bahis, tenis bahis,
esports bahis, sanal bahis, sanal spor bahis, köpek yarışı bahis,
at yarışı bahis, greyhound bahis, poker freeroll, escort bayan, escort istanbul,
escort ankara, escort izmir, escort bursa, escort adana, escort kocaeli,
escort mersin, escort antalya, escort gaziantep, escort konya,
escort diyarbakır, escort aydın, escort kayseri, vip escort,
ucuz escort, eve gelen escort, otele gelen escort,
saatlik escort, gecelik escort, haftalık escort, çıkmalık escort, rezidans
escort, öğrenci escort, yabancı escort, rus
escort, ukraynalı escort, arap escort, sarışın escort, esmer escort, olgun escort
bedava bitcoin, ücretsiz kripto, casino bonus, casino sitesi, güvenilir casino,
online casino, canlı casino, slot oyunları, rulet oyna, poker oyna, blackjack oyna,
bahis sitesi, güvenilir bahis, canlı bahis, spor bahisleri,
yüksek oran bahis, kaçak bahis, bedava bahis, deneme bonusu, hoşgeldin bonusu, casino free spin, slot free spin, kumar sitesi,
kumarhane, çevrimiçi kumar, illegal bahis, yasa dışı bahis, illegal casino, yasadışı kumar, kayıt olmadan bahis, kimlik doğrulama yok bahis, bahis para yatır, bahis para çek,
casino para çekme, casino para yatırma, slot
jackpot, jackpot casino, bedava casino, ücretsiz casino, casino demo, canlı krupiye,
canlı rulet, canlı blackjack, canlı poker, canlı baccarat, baccarat oyna, baccarat sitesi,
çevrimsiz bonus, yatırımsız bonus, çevrim şartsız bonus, kayıp bonusu, kayıp iadesi, free bet, freespin, casino cashback, bahis cashback,
bedava iddaa, maç izle bahis, canlı maç bahis, futbol
bahis, basketbol bahis, tenis bahis, esports bahis, sanal bahis, sanal spor bahis, köpek yarışı
bahis, at yarışı bahis, greyhound bahis, poker freeroll, escort bayan, escort istanbul,
escort ankara, escort izmir, escort bursa, escort adana, escort kocaeli, escort mersin, escort antalya, escort
gaziantep, escort konya, escort diyarbakır, escort aydın,
escort kayseri, vip escort, ucuz escort, eve gelen escort, otele gelen escort, saatlik escort, gecelik escort, haftalık escort, çıkmalık escort,
rezidans escort, öğrenci escort, yabancı escort, rus escort, ukraynalı escort,
arap escort, sarışın escort, esmer escort, olgun escort
Проблемы с алкоголем? вызвать психиатра-нарколога срочная помощь при алкогольной и наркотической интоксикации. Вывод из запоя, капельницы и поддержка 24/7. Анонимно, быстро и безопасно с выездом врача на дом.
Лучшее путешествие джип туры Крым горы, каньоны и побережье. Увлекательные маршруты, опытные гиды и яркие впечатления от путешествий по Крыму.
Do you trade cryptocurrencies? bitkelttrade.com official automate your transactions and earn passive income. Smart algorithms analyze the market and help you make decisions. Increase your income and reduce risks with modern technology.
Оптовый магазин масло оптом дешево масел и смазок предлагает лучшие цены на бочки 200 литров.
Сопровождение банкротства физических лиц — это комплексная юридическая помощь при списании долгов. Переходите по запросу сколько стоит юрист по банкротству. Специалист проанализирует ситуацию, подготовит документы, взаимодействует с судом и кредиторами, проконтролирует каждый этап процедуры. Вы снижаете риски ошибок, экономите время и получаете законное освобождение от долгов с защитой своих прав и имущества.
Лучшее путешествие https://dzhip-tury-krym.ru горы, каньоны и побережье. Увлекательные маршруты, опытные гиды и яркие впечатления от путешествий по Крыму.
Do you trade cryptocurrencies? bitkelttrade reviews automate your transactions and earn passive income. Smart algorithms analyze the market and help you make decisions. Increase your income and reduce risks with modern technology.
6y0x0f
Do you trade cryptocurrencies? trade smarter with bitkelttrade automate your transactions and earn passive income. Smart algorithms analyze the market and help you make decisions. Increase your income and reduce risks with modern technology.
Купить 3D-принтеры https://reporter63.ru/content/view/786013/zagolovok-razvitie-3dpechati-kak-novaya-tehnologiya-menyaet-nash-mir в Минске — продажа оборудования для печати пластиком и фотополимером. Подбор, консультации и гарантия. Найдите идеальный 3D-принтер для ваших задач.
Продажа 3D-принтеров http://reporter63.ru/content/view/786012/zagolovok-3dprinter-revolyuciya-v-proizvodstve-i-tvorchestve Минск — FDM, SLA и другие технологии печати. Широкий ассортимент, выгодные цены и профессиональные консультации. Подберите устройство под свои задачи.
Главные новости: https://svetasanders.com/search/label/%D0%BF%D0%BE%D0%BC%D0%B0%D0%B4%D0%B0/
bedava bitcoin, ücretsiz kripto, casino bonus,
casino sitesi, güvenilir casino, online casino,
canlı casino, slot oyunları, rulet oyna, poker oyna, blackjack oyna, bahis sitesi, güvenilir bahis, canlı bahis, spor bahisleri, yüksek oran bahis, kaçak bahis, bedava bahis, deneme bonusu,
hoşgeldin bonusu, casino free spin, slot free spin,
kumar sitesi, kumarhane, çevrimiçi kumar, illegal
bahis, yasa dışı bahis, illegal casino, yasadışı kumar, kayıt olmadan bahis, kimlik doğrulama yok bahis, bahis para yatır, bahis para çek,
casino para çekme, casino para yatırma,
slot jackpot, jackpot casino, bedava casino, ücretsiz casino, casino demo,
canlı krupiye, canlı rulet, canlı blackjack, canlı poker, canlı baccarat, baccarat oyna, baccarat
sitesi, çevrimsiz bonus, yatırımsız bonus, çevrim şartsız bonus, kayıp
bonusu, kayıp iadesi, free bet, freespin, casino
cashback, bahis cashback, bedava iddaa, maç izle bahis, canlı maç bahis, futbol bahis, basketbol bahis, tenis bahis, esports bahis,
sanal bahis, sanal spor bahis, köpek yarışı bahis, at yarışı bahis, greyhound bahis, poker freeroll,
escort bayan, escort istanbul, escort ankara, escort izmir, escort bursa,
escort adana, escort kocaeli, escort mersin, escort
antalya, escort gaziantep, escort konya, escort diyarbakır, escort aydın,
escort kayseri, vip escort, ucuz escort, eve gelen escort, otele gelen escort, saatlik escort,
gecelik escort, haftalık escort, çıkmalık escort, rezidans
escort, öğrenci escort, yabancı escort, rus escort, ukraynalı escort,
arap escort, sarışın escort, esmer escort, olgun escort
Утилизация биоотходов https://stroi-musor.su вывоз и переработка пищевых и растительных отходов. Экологичные решения, соблюдение стандартов и надежный сервис для предприятий и частных клиентов.
ЖК Солянка Парк https://tzstroy.su современный жилой комплекс с удобной инфраструктурой и комфортной средой. Квартиры с продуманными планировками, благоустроенная территория и удобная транспортная доступность.
ГНБ бурение https://stroytex.su современный способ прокладки инженерных сетей без раскопок. Подходит для дорог, рек и плотной застройки. Точная технология, сокращение сроков и минимальные затраты.
Дистанционное банкротство физического лица — это удобный способ списать долги без личных визитов в суд и офисы. Переходите по запросу бесплатная консультация юриста по дистанционному банкротству физического лица по телефону. Все этапы проходят онлайн: от консультации до подачи документов и сопровождения дела. Вы экономите время, снижаете стресс и получаете профессиональную поддержку юриста на каждом этапе. Поможем законно избавиться от долгов и начать финансовую жизнь с чистого листа.
Утилизация биоотходов https://stroi-musor.su вывоз и переработка пищевых и растительных отходов. Экологичные решения, соблюдение стандартов и надежный сервис для предприятий и частных клиентов.