Kafkaesque: The Moral Hazard at the Heart of SIL
Kafkaesque: The Moral Hazard at the Heart of SIL Dean Bowman November 18, 2025 Supported Independent Living The Federal Court’s $2 million penalty against Lifestyle Solutions is a stark document. It details 18 incidents of violence over two years at a single group home in Woongarrah, NSW. For providers, it reads like a cautionary tale. But for those […]
The Top 10 NDIS Providers in 2024: Difficulty at scale and lessons for the sector

There’s a persistent rumour in the disability sector that the National Disability Insurance Agency (NDIA) is slowly corralling services into just a handful of mega-providers. But does that theory hold water? Our look at the top 10 attendant care non-profits suggests it might not. Despite commanding over billions in combined revenue, these organisations still occupy a surprisingly small slice of total NDIS payments and the same difficult operating environment, albeit at substantial scale.
Recent Federal Court Rulings on NDIS Payment Reviews
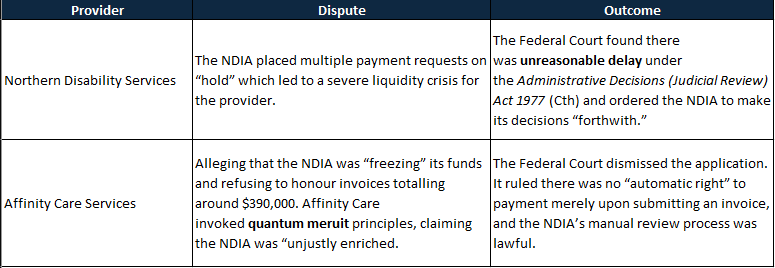
Two recent Federal Court decisions have shed new light on how the National Disability Insurance Agency (NDIA) handles payment reviews for NDIS service providers. While no doubt many of you have heard of “periodic payment reviews”, these cases provide some crucial insight into how they function. If you operate in this space—especially on thin margins—understanding these rulings may be critical to protecting your organisation’s cashflow and ensuring regulatory compliance.
QSC’s Own Motion part 2: how staff quality and practice leadership impact resident safety
As part 2 of the series, this article delves into the drivers of staff-generated abuse, evaluates the chances of implementing meaningful change, and outlines three ways providers can respond to the Own Motion Inquiry.
QSC’s Own Motion part 1: how safe is Supported Independent Living?
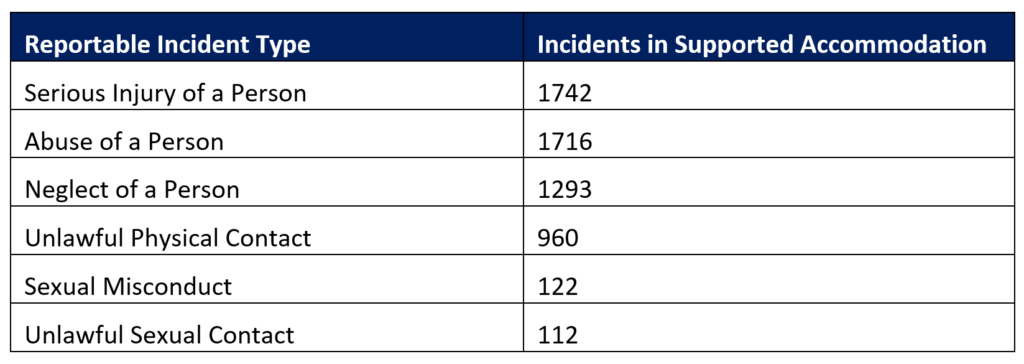
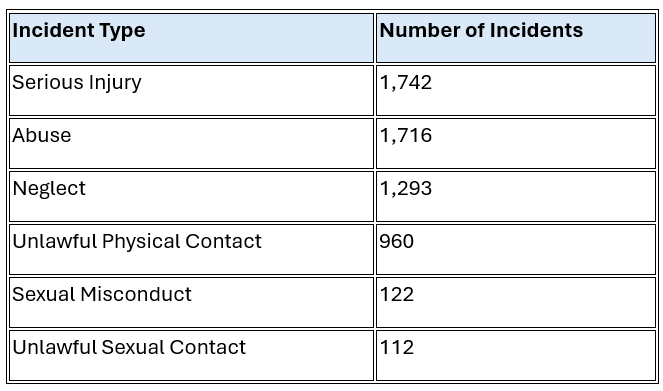
Examining 6,269 reportable incidents across 7 major providers and 1075 SIL sites, the study represents a significant portion of the SIL cohort, as the selected providers account for 18% of the total. The report suggests that although it is unlikely to lead to the “abolishment” of group homes, there are serious issues that must be addressed.
It’s not easy being a big SIL provider
It’s been a tough year for major providers. Unfortunately, they’re on the wrong end of a confluence of impacts. This means that transformation efforts are complicated because, in most cases, nearly all business functions are impacted by the NDIS cost model.
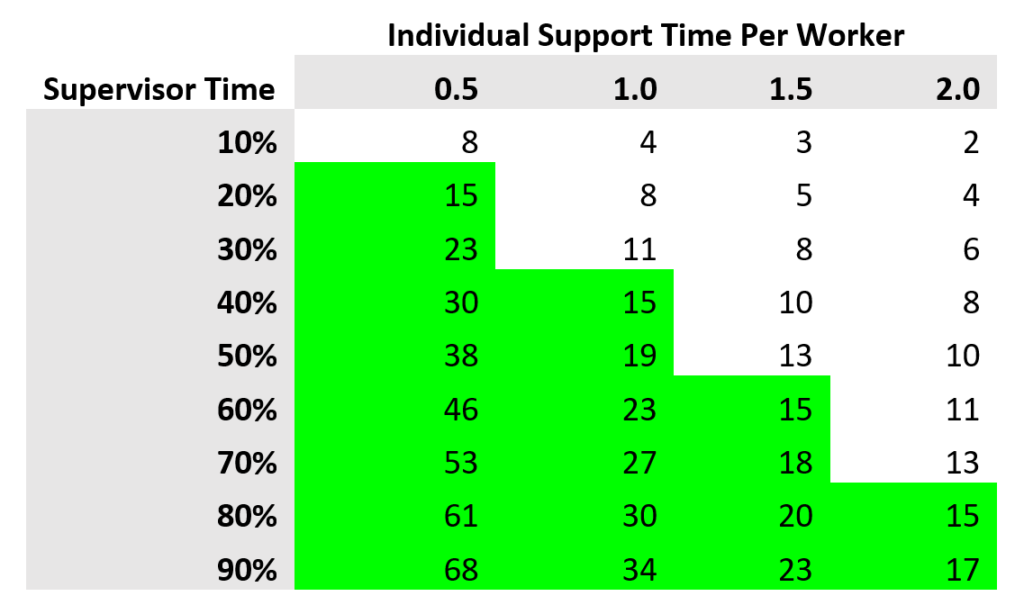
Is it getting harder to fill SIL vacancies?

We keep hearing across the sector that filling Supported Independent Living (SIL) vacancies is becoming increasingly more difficult for providers. As always, we reviewed the NDIS data to validate this assumption, and this is what we found.
A closer look at SIL profitability in 2022

Supported Independent Living (SIL) profitability varies significantly between providers. While many in the NDIS assume that most providers converge on margins of only 2% given the cost model, our data tells us the average margin SIL margin was 4.5%, with considerable variance (3.15% SD).
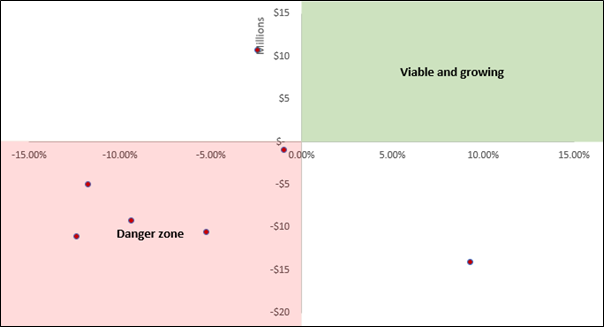
The big SIL providers are still struggling

This quarter, we consolidated the 2022 Supported Independent Living (SIL) data to review the performance of the biggest providers, and most are still struggling.
The big issue with funding

This chart shows the average cost per decile in funding for 2020-2021. What is fascinating about this chart is that it is controlled for SIL status, age, disability type and presentation intensity. Essentially, this chart isolates the variation that is produced by individual circumstances, interpretations of “reasonable and necessary”, and intra-planner variation. In a nutshell, this chart shows that plans vary wildly even when controlling for intensity, disability type, age and SIL Status.