Know Why Houses Underperform. Fix It With Confidence.
Connect your roster, funding, and cost data to see exactly why houses underperform and what to do about it. Make evidence-based decisions that improve margins whilst protecting service quality.
Quick Navigation
Integrated Intelligence for SIL Operations
Most SIL providers face the same challenge: their P&L shows a house is underperforming, but doesn't explain why or what to do about it. Is it overstaffing? Poor ratio matching? Inadequate funding? Operational execution problems?
How It Works
Calculate Required Staffing
Our tool analyses your RoC to determine the minimum compliant staffing needed to meet each participant's funded support requirements.
Compare Actual vs Required
Our tool reconciles your payroll data with the RoC to identify exactly where you're overservicing, where ratios are inefficient, and where funding gaps exist.
Optimise the RoC
Our tool helps you restructure Rosters of Care to maximise revenue efficiency whilst maintaining SCHADS compliance and service quality.
Make It Sustainable
Every change is validated for operational feasibility, staff capacity, and participant outcomes before implementation.
Why Your P&L Can't Tell You This
Your P&L shows one number: "House X made 3% margin instead of 6%." But it doesn't separate:
- • Revenue losses from underfunded support requirements
- • Structural wage costs (penalty rates, overtime) from roster design
- • Controllable overservicing from inefficient ratios
- • Overhead allocation inefficiencies
We disaggregate the performance drivers. Business leaders get granular house-level data with a single click, showing exactly which levers to pull.
Expected Outcomes: What Providers Typically Achieve
Based on implementation across 20 houses managing 62 participants
Average house margin increase through structural RoC review, overservicing elimination, and overhead allocation optimisation
Decrease in time spent on RoC management, financial analysis, and manual error correction
Complete visibility into whether committed support hours are actually being delivered to participants
Average number of actionable margin recovery opportunities identified per house in portfolio analysis
What P&L Alone Cannot Tell You
A real scenario showing the difference between traditional analysis and platform-enabled insights
Managing by P&L Alone
House Performance (Monthly)
Management Response:
"Wages are 73% of revenue. We need to cut staffing hours"
But which hours? Are we overservicing agreed Rosters of Care? Is our revenue recognition incorrect? Is there an unaccounted vacancy driving the margin down? The P&L can't tell us, so decisions become guesswork.
Risk:
- May cut staffing participants are actually paying for
- Impossible to know which hours to reduce
- Service quality compromise and compliance breach
- Arbitrary decisions without understanding root causes
- Participants lose supports they've funded
Managing with Integrated Intelligence
House Performance (Monthly)
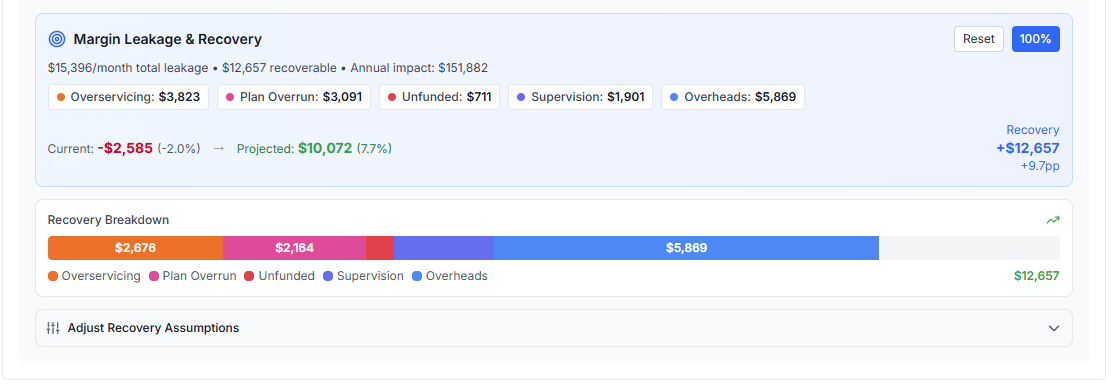
Platform Diagnosis: Margin Leakage & Recovery
Payroll reconciliation showed 5 hours delta from RoC on Sunday
RoC requires 6 additional hours beyond participant funding
Support hours not covered by any NDIS plan (ratio shortfall)
Supervision costs above 5.36% of revenue (supervisor over-allocation)
Overheads above 10.5% target (overhead misallocation)
Evidence-Based Action:
Overservicing ($3,823): Payroll reconciliation showed a 5 hours delta from the RoC on Sunday.
Plan Overrun ($3,091): RoC requires 6 additional hours beyond participant funding. Requires revision or discussion with participant and support network.
Structural Issues ($8,481): Unfunded ratios (ratio shortfall), overhead misallocation, and supervisor over-allocation.
Outcome:
- $15,396 monthly recovery identified ($184,751 annually)
- Zero participant impact. Recovered leakage is unfunded costs
- Evidence-based discussions with participant and network
- Wage-to-revenue improves to 61.1% without cutting funded hours
"We identified $847K in annual overservicing across our portfolio without compromising a single participant outcome. The platform showed us exactly where our RoCs, rosters and allocations were misaligned. SIL requires granular attention to the smallest detail, which can be challenging at scale. These tools automate it."
Two Products, One Integrated System
Dashboard shows you what's happening. Optimiser helps you improve it. Integration creates confidence.
Dashboard
Performance Intelligence
Purpose: Reconcile payroll to RoC, identifying daily variances between what was rostered and what was delivered.
Key Capabilities:
- Ingests RoC and payroll data for automated reconciliation
- Normalisation steps to align data sources
- Determines required supports vs actual delivery
- Individual daily variance analysis
- Identifies overservicing, underservicing, and structural RoC issues
Optimiser
Portfolio-Wide Roster Planning & Analysis
Purpose: Build evidence-based rosters that optimise funding utilisation whilst maintaining quality, with complete portfolio visibility and audit trail.
Key Capabilities:
- Whole portfolio view with integrated analysis components
- RoC creation, RoC solver and review automation
- Real-time funding impact visibility for every roster change
- Scenario modelling ("what if we change this ratio?")
- Version control, approval workflows, and ownership allocation
Platform Feature Tour
Quick walkthrough of Dashboard and Optimiser working together
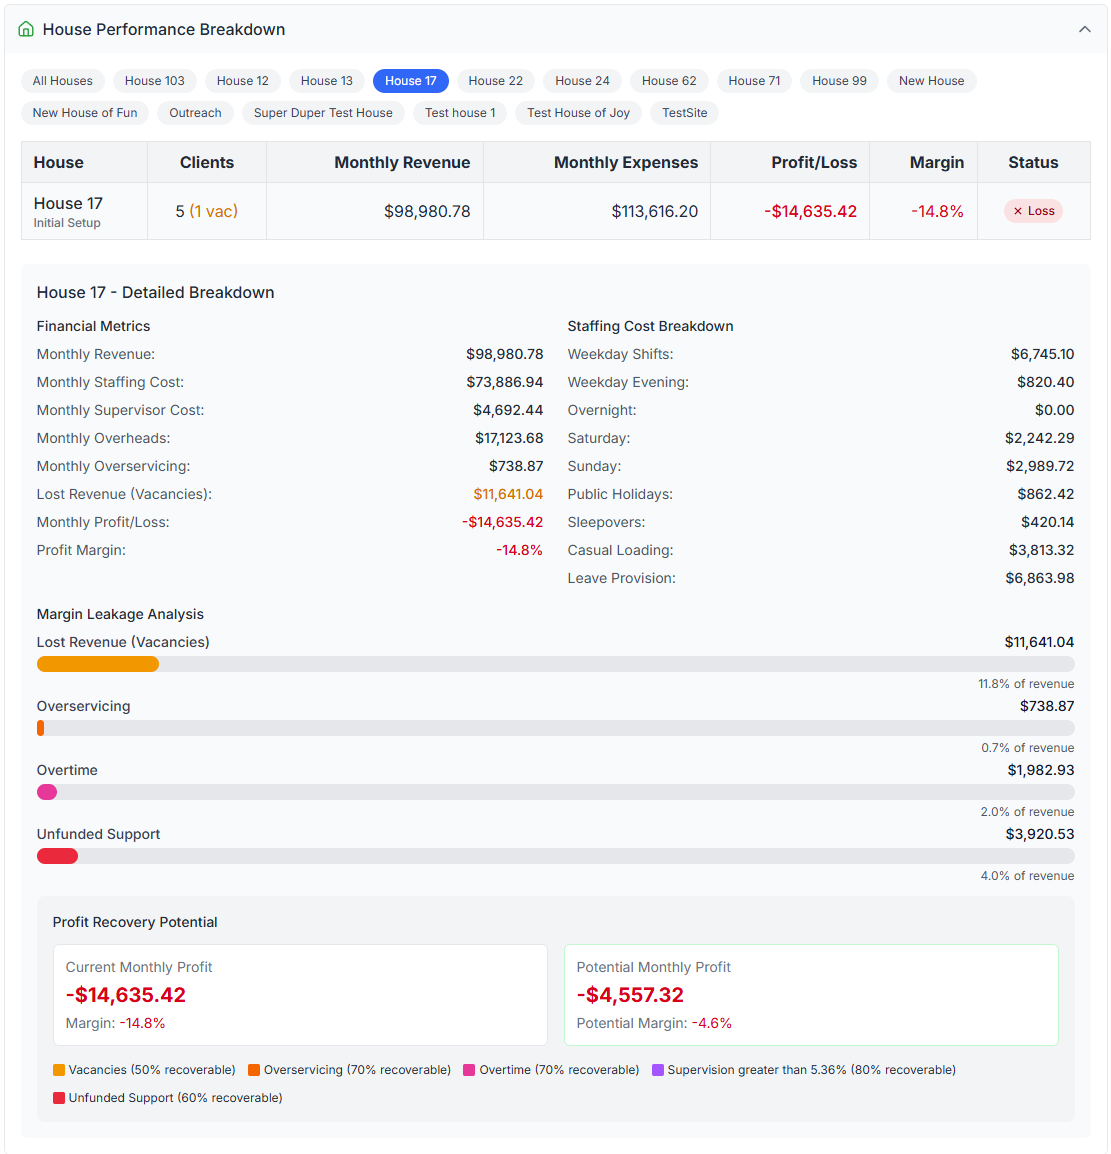
Dashboard: See Exactly What's Happening
Stop guessing why houses underperform. Dashboard connects your RoC, funding, and cost data to show you the complete picture.
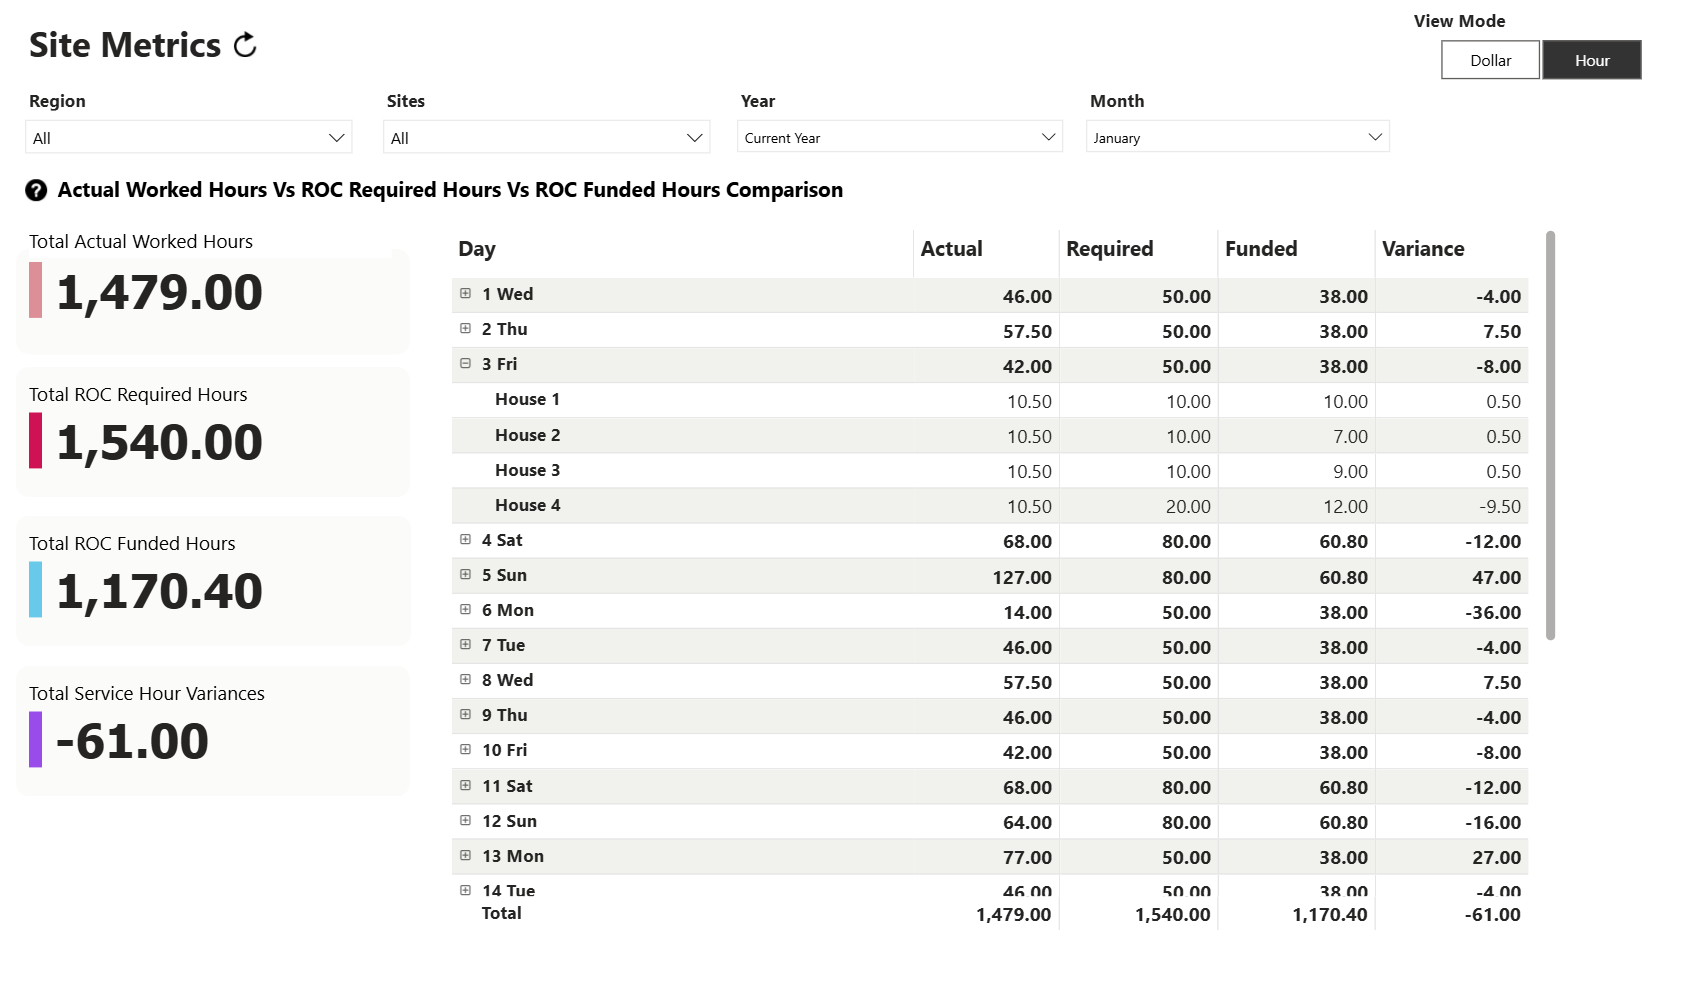
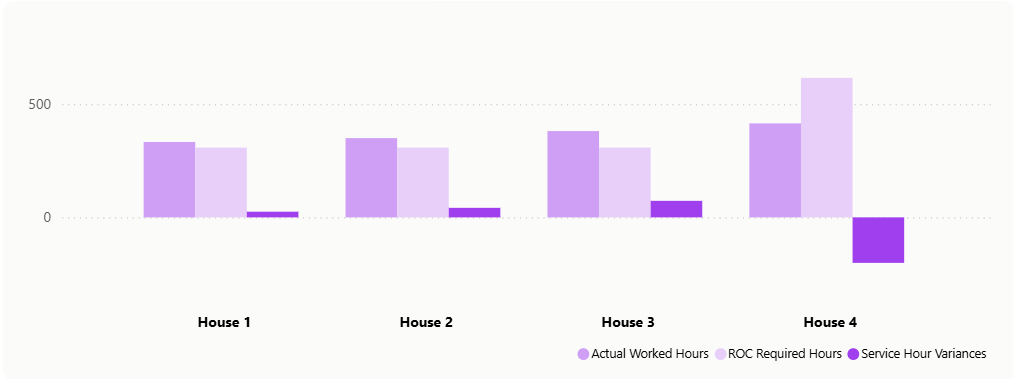
Portfolio overview showing all houses at a glance
Four Essential Reconciliation Insights
Daily Delivery Variance Analysis
Track exactly when actual staffing deviates from your RoC commitments
- Rostered vs Delivered: Compare what was planned in the RoC against actual payroll records for each day
- Overdelivery Detection: Identify where staff worked beyond rostered hours (unplanned overtime, extended shifts)
- Underdelivery Detection: Spot when rostered support wasn't delivered (call-outs, no-shows, early finishes)
- Shift-Level Granularity: See exact variances by shift, day, and staff member
Why This Matters: Overdelivery costs money you didn't budget for. Underdelivery risks non-compliance with RoC commitments and participant outcomes.
Ratio Compliance Verification
Confirm that delivered support ratios match RoC specifications
- Actual Ratios Delivered: Calculate real participant-to-staff ratios from payroll data
- RoC Ratio Commitments: Compare against documented minimum ratio requirements
- Breach Identification: Flag instances where delivered ratios fell below RoC commitments
- Pattern Recognition: Identify recurring compliance issues across houses or shifts
Why This Matters: Ratio breaches expose you to NDIS Commission scrutiny and compromise participant safety. Early detection prevents systemic issues.
Normalised Minimum Roster Baseline
Intelligent baseline that accounts for real-world constraints and funding realities
- Ratio Misalignment Adjustment: Normalises RoC for unfunded ratio requirements (where documented ratios exceed what funding supports)
- Vacancy Impact Adjustment: Accounts for empty beds and adjusts expected staffing accordingly
- Minimum Required Roster: Builds the true baseline of what should have been delivered given funding and occupancy
- Sufficiency Assessment: Determines whether actual staffing met, exceeded, or fell short of this normalised baseline
Why This Matters: Raw RoC-to-payroll comparison is meaningless if the RoC was undeliverable. Normalisation shows whether variances are legitimate operational issues or structural roster problems.
Systematic Overdelivery Detection
Identify houses where delivery consistently exceeds what the RoC allows for
- Persistent Variance Patterns: Distinguish one-off operational issues from structural overdelivery habits
- House-Level Benchmarking: Compare variance patterns across portfolio to identify systematic offenders
- Cost Impact Quantification: Calculate cumulative financial impact of recurring overdelivery
- Root Cause Indicators: Surface whether systematic overdelivery stems from roster inadequacy, operational execution, or poor ratio discipline
Why This Matters: If a house consistently delivers more than rostered, either the RoC is wrong or operational discipline is lacking. This shows exactly where intervention is needed.
Key Dashboard Features
Easy Data Upload
Effortless tools to grab your key data. Battle-tested normalisation steps to convert RoCs into essential data sources.
Inbuilt Business Logic
Automatically determines minimum rosters and funding gaps. Built-in understanding of SCHADS requirements and SIL funding models.
Variance Detection
Automatically determines variances between funded, minimum, and actual rosters to detect under and overservicing on a per-day basis.
Drill-Down Analysis
Visualise and drill down into key data. Shows where to focus improvement efforts.
Export Capabilities
Export detailed reports and analysis for board presentations, audits, or deeper investigation.
Real-Time Updates
As roster data changes, dashboard automatically recalculates all metrics and flags new issues.
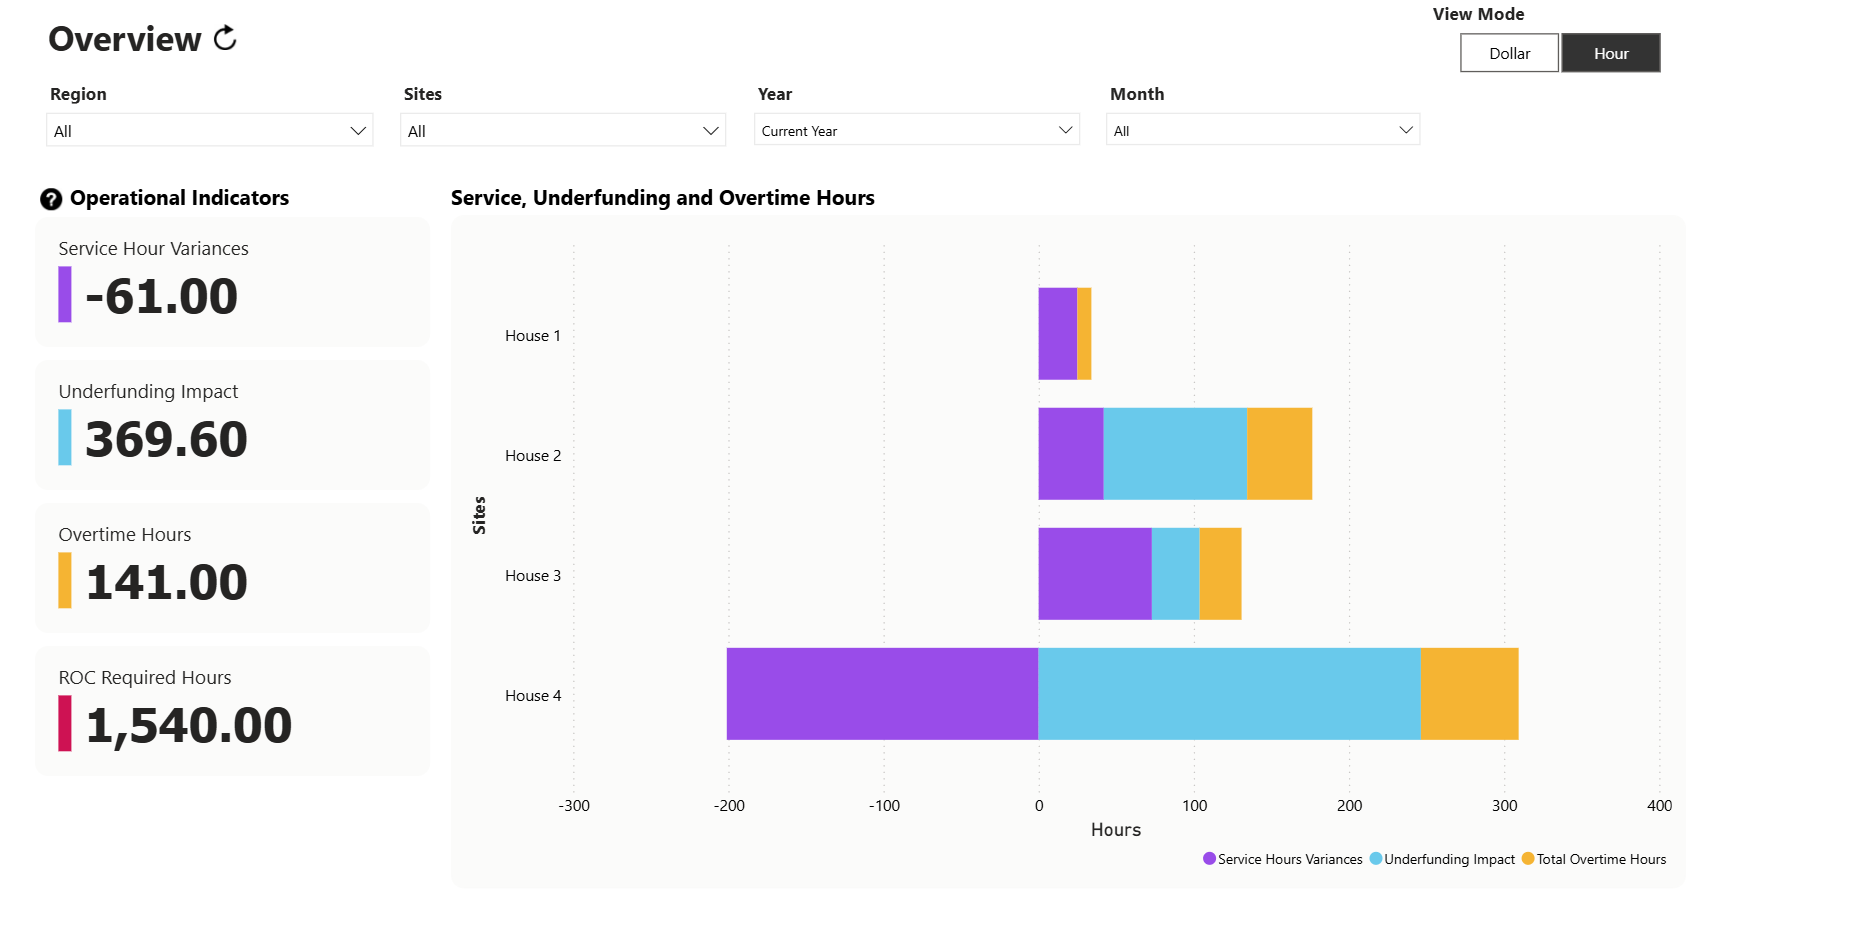
Portfolio overview showing all houses at a glance
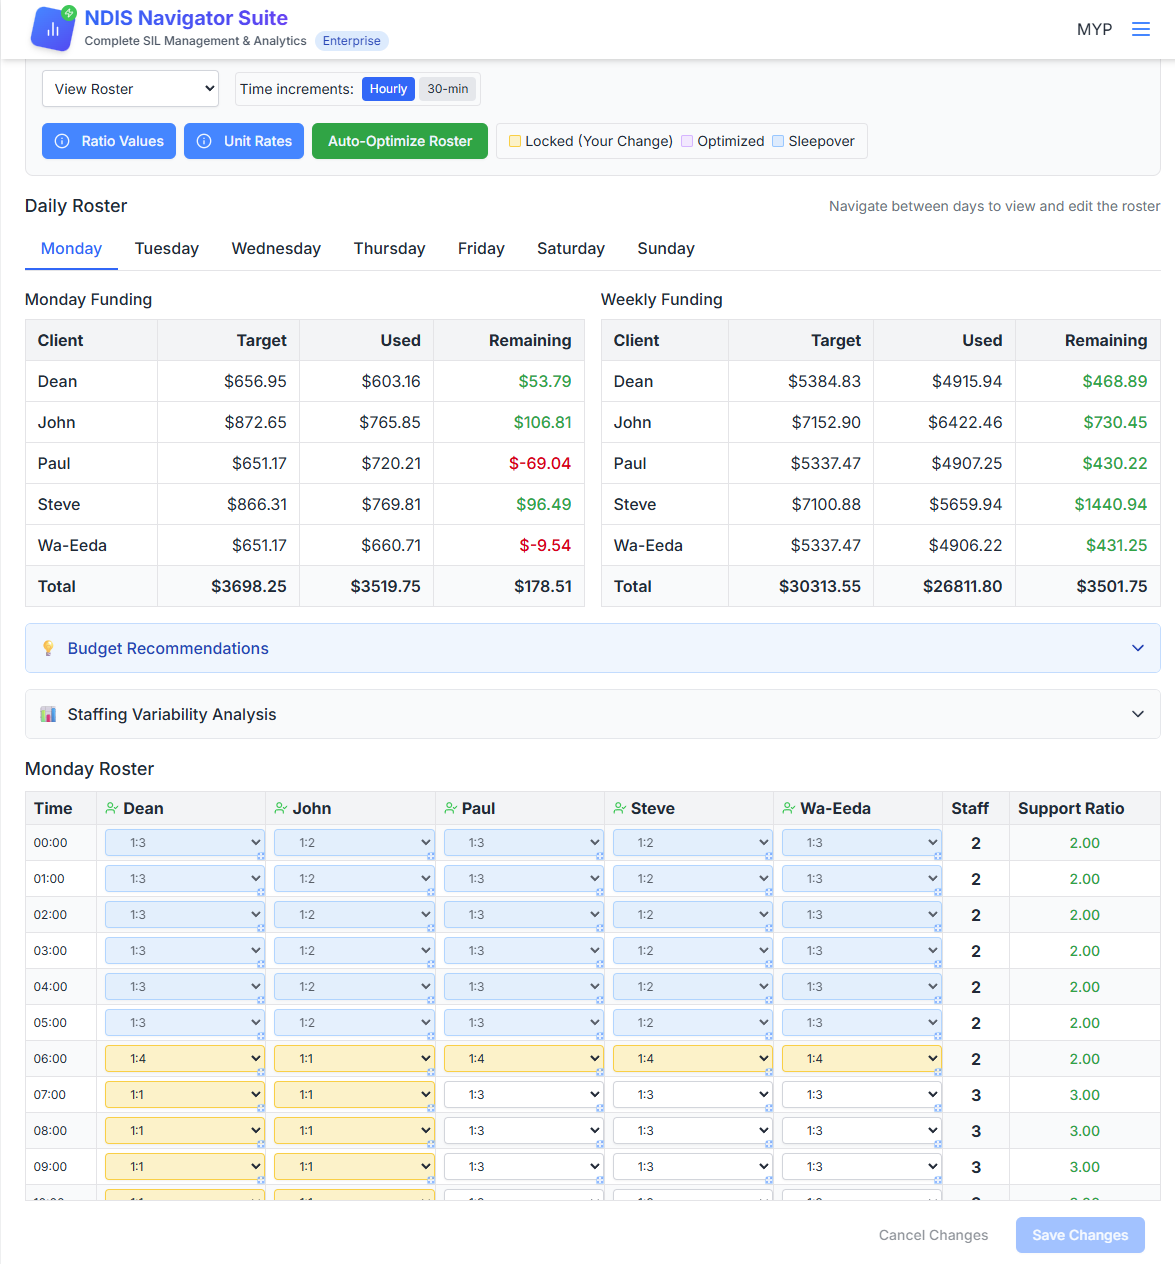
Optimiser: Make Evidence-Based Roster Decisions
Dashboard shows the problem. Optimiser lets you fix it. Integration ensures every decision is evidence-based, compliant, and fully documented.
Full roster planning view with real-time funding impact analysis
How the Optimiser Works
Set Participants
Enter participant details: funding level, needs assessment, funded hours
Build Roster
Define support ratios for each timeslot based on participant needs and activities
Review Impact
See real-time funding consumption, SCHADS compliance, and cost projections
Save & Audit
Version control captures every change with timestamp, user, and approval status
Key Optimiser Capabilities
Automated RoC Creation & Solver
Build rosters from scratch or optimise existing ones with intelligent automation
- Quick Setup: Input participant funding, needs, and occupancy patterns to generate initial rosters
- Ratio Optimisation: Solver automatically adjusts ratios to maximise funding efficiency whilst meeting requirements
- Portfolio Repository: Centralised storage for all RoCs with easy access and version management
- Key Metric Surfacing: Instantly see funding burn rate, margin impact, and unfunded support for every roster configuration
Why This Matters: Stop building rosters in Excel with manual calculations. Automation ensures accuracy and surfaces optimisation opportunities you'd miss manually.
Comprehensive Financial Analysis Suite
Model the exact financial impact of any roster change before implementation
- Real-Time Impact Modelling: See margin, revenue, and cost changes instantly as you adjust ratios
- Cost Driver Breakdown: Understand base staffing costs, penalty rates, overheads, and unfunded support
- Scenario Comparison: Create multiple "what if" scenarios and compare financial outcomes side-by-side
- Participant-Level Detail: Track each participant's funding consumption, funded hours vs rostered hours, and annual projections
Why This Matters: Make roster decisions with complete financial transparency. Know exactly how every change affects house profitability before you commit.
Portfolio-Wide Performance Aggregation
Interrogate and optimise all RoCs across your entire portfolio in one place
- Consolidated View: See total portfolio performance, aggregated margins, and overall funding utilisation
- Structural Issue Detection: Identify systematic problems across houses (ratio misalignment, unfunded support patterns)
- Comparative Benchmarking: Compare house performance to identify what excellent execution looks like
- Opportunity Quantification: Calculate total recoverable margin across portfolio from identified inefficiencies
Why This Matters: Stop analysing houses in isolation. Portfolio-wide visibility reveals patterns and opportunities that single-house analysis misses.
Financial Forecasting Tools
Project future performance and model strategic changes across time horizons
- Annual Projections: Forecast full-year outcomes based on current roster configurations
- Participant Change Modelling: Model impact of new admissions, departures, or funding changes on house economics
- Growth Planning: Assess whether new participants are financially viable given current roster structures
- Month-by-Month Variance: Understand how public holidays, weekends, and occupancy patterns affect monthly margins
Why This Matters: Stop making decisions based on current state alone. Forecasting prevents mid-year funding crises and enables confident strategic planning.
Portfolio overview showing all houses at a glance
Why Integration Matters: Dashboard + Optimiser
Standalone tools create data silos. Integration creates intelligence.
The Plan → Monitor → Improve Loop
- Optimiser designs: Build the initial RoC with optimal ratios, funding utilisation, and projected margins
- Dashboard monitors: Reconcile payroll against the RoC, identifying "House 7 consistently delivers 5 extra hours every Thursday/Saturday"
- Optimiser models: Test whether the variance is structural (RoC inadequate) or operational (poor execution), model corrections
- Dashboard confirms: After implementing changes, verify the variance is eliminated and margin improves by $42K annually
The Confidence Multiplier
- Evidence-Based Decisions: Every RoC change backed by Dashboard data showing exact financial impact of delivery patterns
- Complete Financial Visibility: Optimiser models the plan, Dashboard validates actual performance, together they show true house economics
- Stakeholder Communication: Show Plan Managers precise data on funding shortfalls vs operational inefficiencies with evidence from both systems
- Continuous Improvement: Systematic feedback loop between planning and delivery creates ongoing margin optimisation
Bottom Line: Plan Smart, Monitor Reality, Optimise Continuously
Optimiser ensures your RoCs are financially viable. Dashboard shows whether they're being delivered as planned. Integration creates the feedback loop that drives continuous margin improvement.
Value for Every Key Stakeholder
Different roles need different outcomes. Here's what each stakeholder gets.
For CEOs: Strategic Control Without Operational Overload
Your Challenge:
You need to improve financial performance whilst protecting service quality—but lack visibility into where improvement opportunities actually exist. Board asks for margin improvement, but current reporting can't tell you whether that's achievable without compromising participants.
What You Get:
- Strategic Dashboard: Portfolio-wide visibility into performance by house, enabling data-driven resource allocation decisions
- Board-Ready Reporting: Demonstrate to Board exactly what's driving underperformance and what actions are being taken
- Risk Visibility: Early warning system for delivery issues and funding overruns before they become crises
- Growth Enablement: Identify which houses can absorb new participants vs. which need restructure first
Expected CEO Outcomes:
- Confidence: Make strategic decisions backed by evidence, not intuition
- Performance: Portfolio margin improvement of 2-5% without quality compromise
- Governance: Evidence-based decision trail demonstrating due diligence in roster and funding management
- Time: Stop firefighting—focus on strategy instead of operational crises
Bottom Line: Run your organisation with confidence that financial decisions are protecting (not compromising) participant outcomes.
For CFOs: Precision Financial Management Beyond P&L
Your Challenge:
P&L shows houses underperforming but doesn't tell you why or what to do about it. You know costs are high but can't differentiate between legitimate funding shortfalls, operational inefficiency, and penalty rate impacts—so you can't give operations actionable guidance.
What You Get:
- Root Cause Clarity: Every underperforming house explained: base cost, penalty rates, overservicing, vacancy impact
- Forecasting Accuracy: Understand funding utilisation trajectory to predict cash flow and margin with confidence
- Business Case Support: Evidence-based data for Plan Manager negotiations when funding is genuinely insufficient
- Portfolio Benchmarking: Compare house performance to identify operational excellence vs. structural funding problems
Expected Financial Outcomes:
- Accuracy: House-level P&L that actually explains performance drivers
- Control: Identify and eliminate 10-15% overservicing cost across portfolio
- Predictability: Funding utilisation tracking that prevents mid-year service reduction crises
- Efficiency: Reduce month-end financial analysis time by 55% through automated reconciliation and reporting
Bottom Line: Move from "we're underperforming" to "here's exactly why and what to do about it."
For COOs: Operational Excellence Without Compromising Service Quality
Your Challenge:
You're responsible for both operational efficiency AND service quality—two objectives that appear to conflict when margins tighten. When finance pressures you to reduce costs, you lack tools to identify where efficiencies exist without compromising participant outcomes.
What You Get:
- Service Quality Protection: Before any roster reduction, understand exactly how the change affects each participant's funded support hours
- Performance Diagnostics: When a house underperforms, see whether it's roster inefficiency, poor ratio matching, funding shortfall, or operational execution
- Portfolio Benchmarking: Compare house performance to identify what excellent execution looks like—then replicate it
- Evidence-Based Decisions: Replace intuition with data showing where genuine efficiencies exist versus where cuts harm quality
Expected Operational Outcomes:
- Quality: Make roster decisions with confidence that service quality is protected
- Efficiency: Identify 10-15% cost reduction opportunities in overserviced houses without participant impact
- Delivery Assurance: Verify rostered support is actually being delivered, eliminating underservicing risk and participant outcome concerns
- Capability: Build operational excellence systematically across portfolio through benchmarking
Bottom Line: Make confident operational decisions backed by data that proves you're improving efficiency whilst protecting (or improving) participant outcomes.
From First Call to Full Value in 90 Days
Phased implementation that delivers immediate value whilst building towards comprehensive capability
RoC Repository Setup
- Immediate integrity audit risk mitigation
- Import existing roster data
- Train staff on version control
- Establish approval workflows
Value Delivered: Audit trail confidence from day one
Financial Analysis Integration
- Connect funding and cost data
- House-level performance diagnostics
- Identify improvement opportunities
- Dashboard training for key staff
Value Delivered: Understand exactly where performance gaps exist
Roster Optimisation
- Implement evidence-based improvements
- Track margin impact in Dashboard
- Refine based on results
- Build house manager capability
Value Delivered: Measurable margin improvement without quality compromise
Portfolio Analytics & Strategic Reporting
- Consolidated business intelligence
- Board-level reporting established
- Strategic decision support capability
- Continuous improvement processes embedded
Value Delivered: Complete operations intelligence system operational
What You Need to Get Started
Minimal technical requirements—we handle the heavy lifting
RoC Documents
Current rosters in any format (PDF, Excel, Word)
Funding Data
Participant funding levels and annual allocations
Cost Data
Labour costs and overhead rates (we help if unavailable)
See What We'd Find in Your Portfolio
Book a 30-minute discovery call. We'll analyse one of your houses and show you exactly what the platform would reveal about your operations.
No pitch deck. Just data-driven insights about your actual performance.
✓ Your Data Remains Yours
We never share provider information or use it beyond your specific analysis
✓ No Lock-In
Month-to-month agreements. If we're not delivering value, you can leave anytime
✓ Australian Support
Local team who understand SIL operations. Not a generic help desk