Understanding SIL Pricing Dynamics: Why Status Quo will Persist
As the disability sector continues advocating for SIL price increases, it's worth examining the economic and political dynamics that...
Synchronise every staff hour with participant needs—keep utilisation strong, quality high, and your mission thriving. Our dashboard harnesses real-time cost, ratio, and labour data so you can seamlessly drive sustainability and quality.
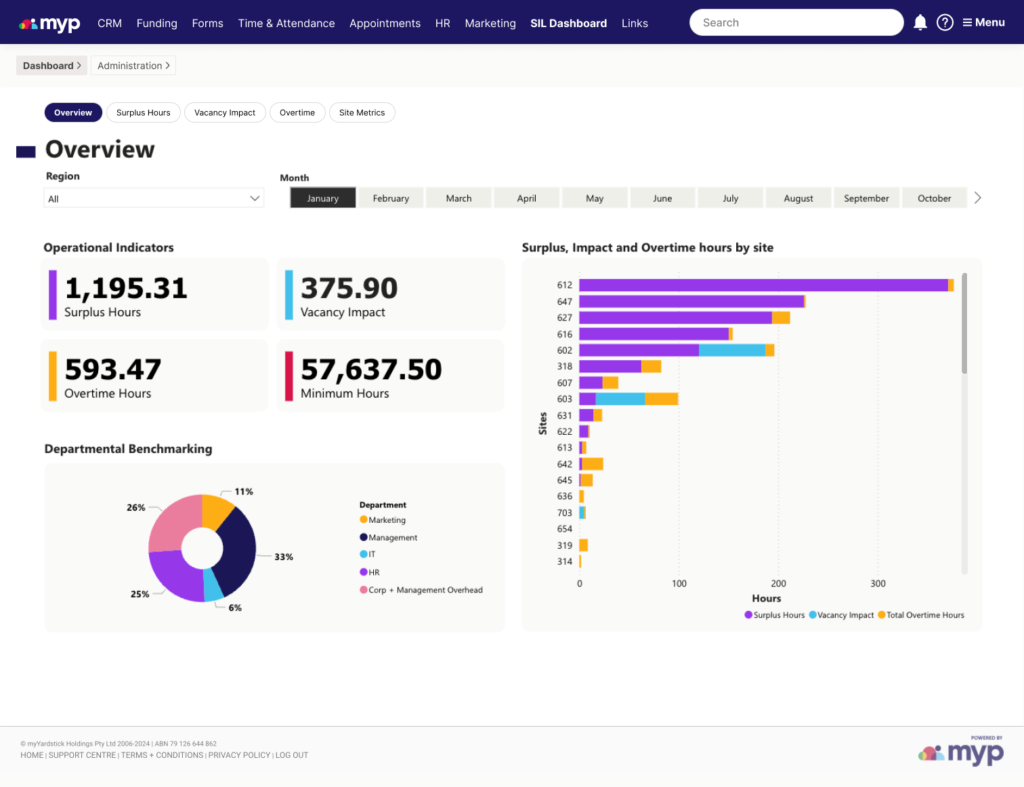
Keep track of your labour, measured directly against your funding. See daily analysis of where labour departed from funding.
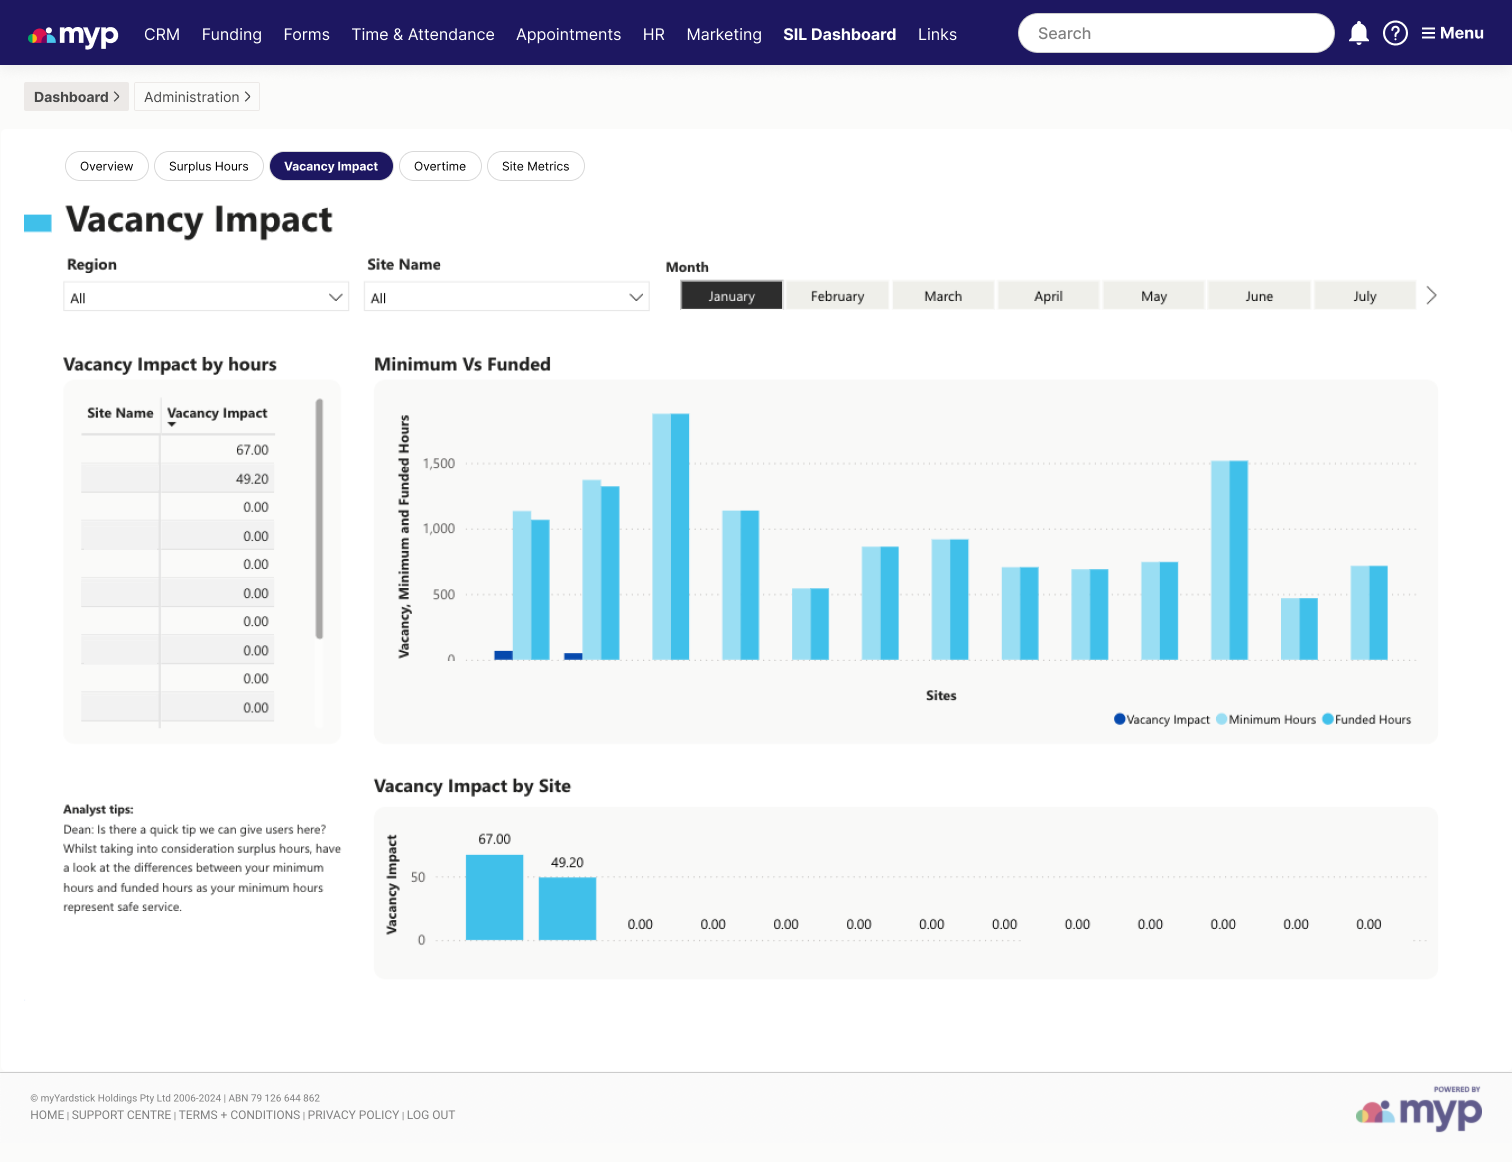
Get direct insight into how ratio mismatches or placement vacancies affect your viability.
Our dashboard is the first to read and normalise Roster of Care (RoC) data. Out of the filing cabinet, driving quality decisions.
Our dashboard is the first to reconcile your labour, funding, vacancy and allocation in a single location, providing a frame of reference for expenditure.
Our consultants have demonstrated experience working in key roles for some of Australia’s most significant and fastest growing NDIS providers
Sustainability in SIL hinges on how closely your actual staffing meets the funding model’s assumptions.
If participant ratios differ from real rosters, or staff time creeps beyond the “theoretically funded” hours, your labor expenses, often $45 or more per service hour, easily overshadow the NDIA’s 2% margin expectation. Our dashboard pinpoints exactly where these gaps arise:
With everything in one clear interface, you can fine-tune schedules, curb overtime, and guard against vacancies that drive up costs—helping your SIL services stay high quality and financially viable.
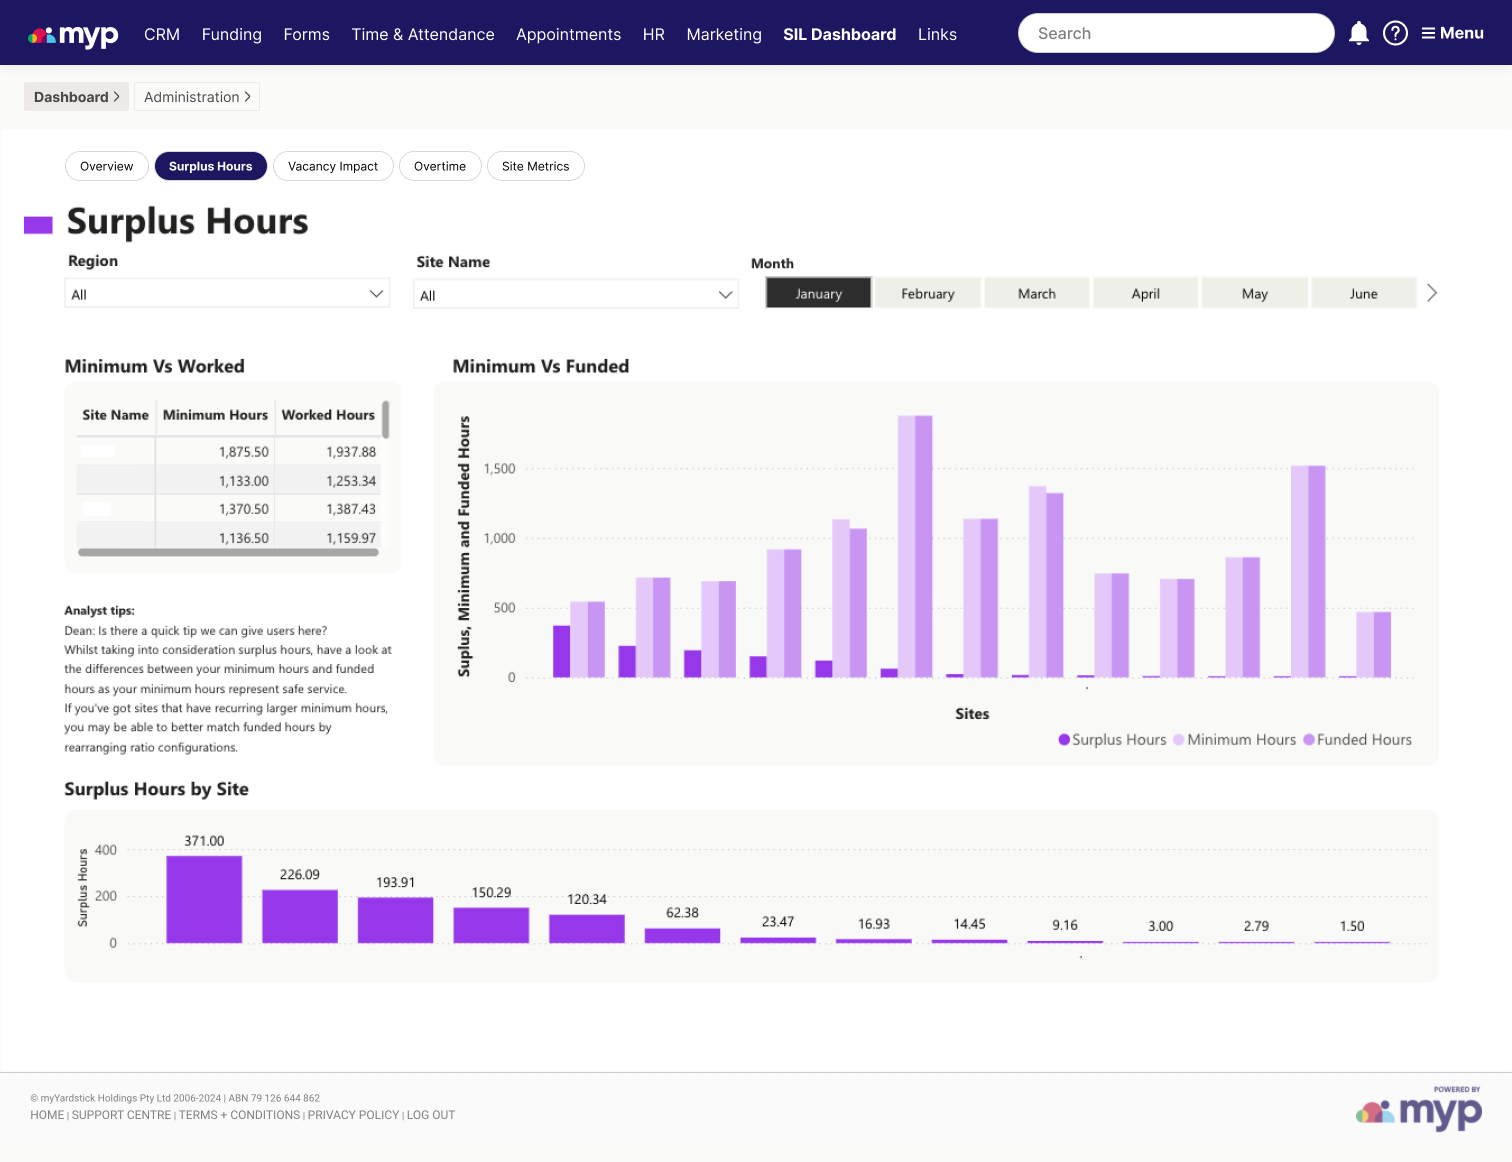
Identify precisely where your rostered hours might be exceeding—or falling short of—what’s covered by participant funding. Our Surplus Hours feature offers a transparent view of any gap between scheduled staffing and actual care requirements, letting you:
Manually tracking Rosters of Care (RoCs), payroll data, and daily attendance with spreadsheets is cumbersome—mistakes accumulate and revenue gaps often stay hidden until month-end. Our dashboard unifies these streams in one place, letting you see and adjust staffing in near real time. That means fewer billing surprises, consistent participant care, and a tighter match between hours worked and the funding that covers them.
By leveraging Surplus Hours data with automated integration, you ensure your SIL services stay closely aligned with both participant needs and available resources—without sacrificing quality or viability.
Identify where mismatched care ratios, unoccupied placements, or Sleepover adjustments leave you covering staff hours without full funding. Our Vacancy Impact tool pinpoints each scenario, so you can:
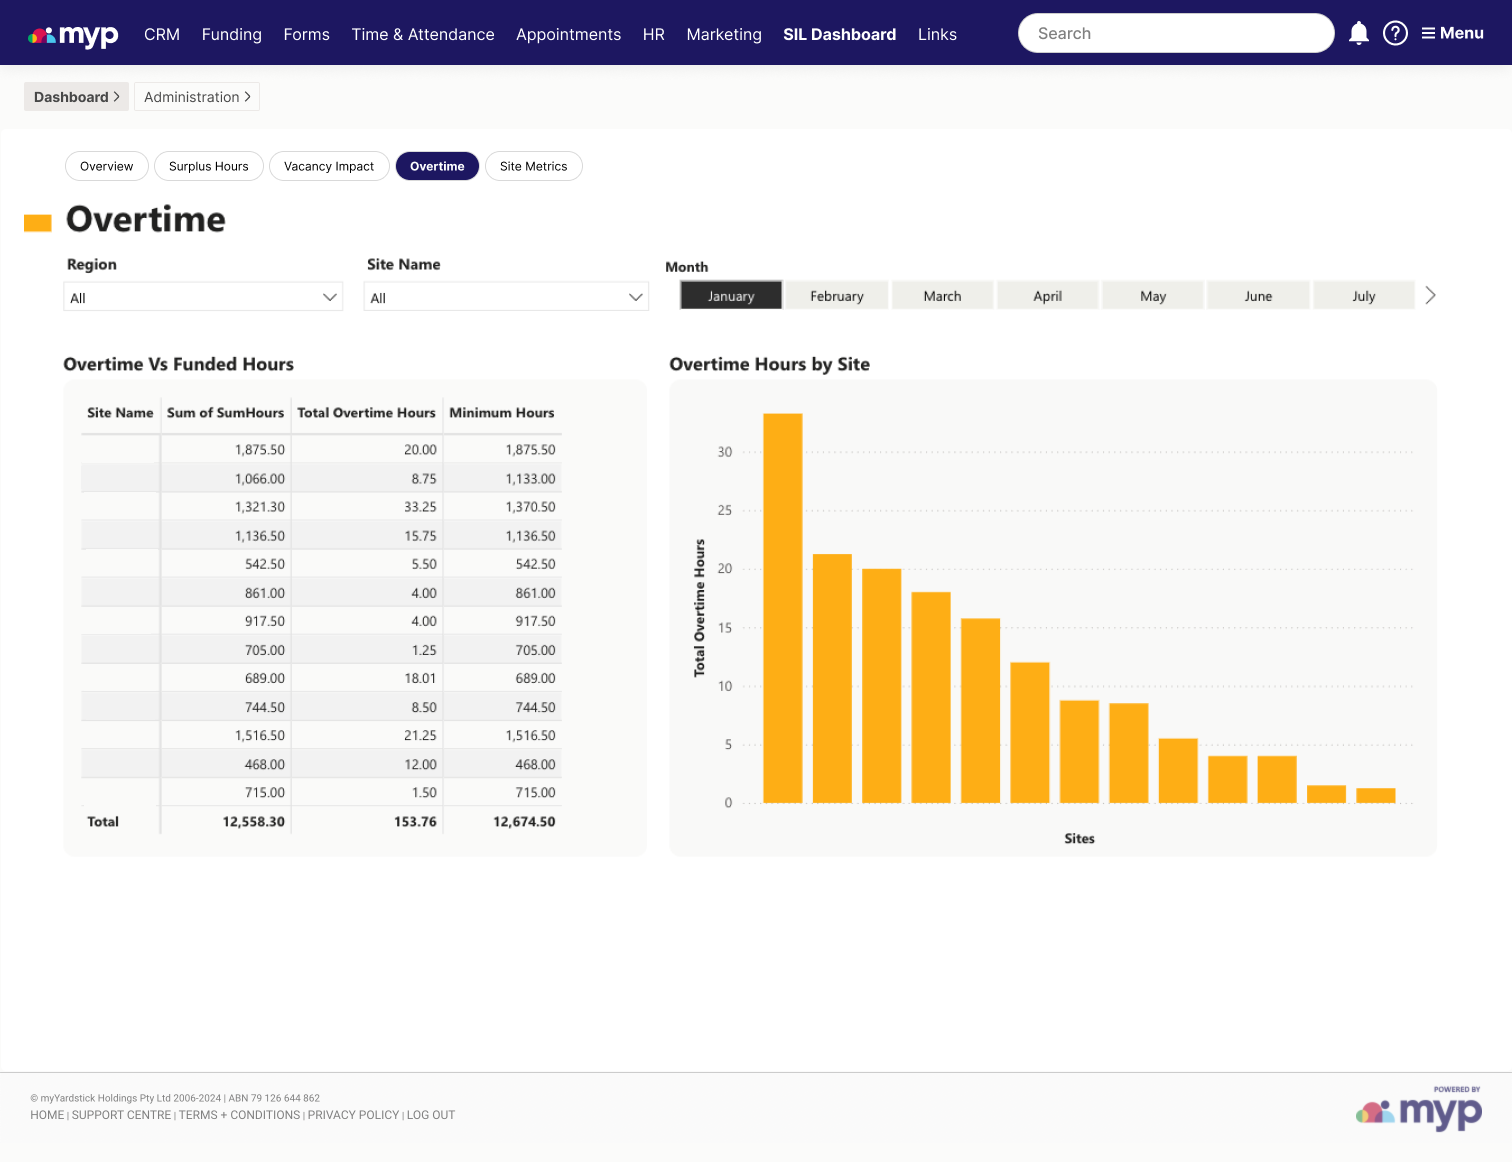
Even if you already track overtime on its own, seeing it alongside Surplus Hours and Vacancy Impact is a game-changer—because labour represents around 75% of your SIL spend. Our dashboard integrates these three metrics to reveal exactly where rising overtime coincides with surplus hours or empty participant slots, so you can:
See at a glance how Surplus Hours, Vacancy Impact, and Overtime interact across every site—alongside each location’s minimum roster requirements. By stitching together these metrics in one normalised dashboard, you can:
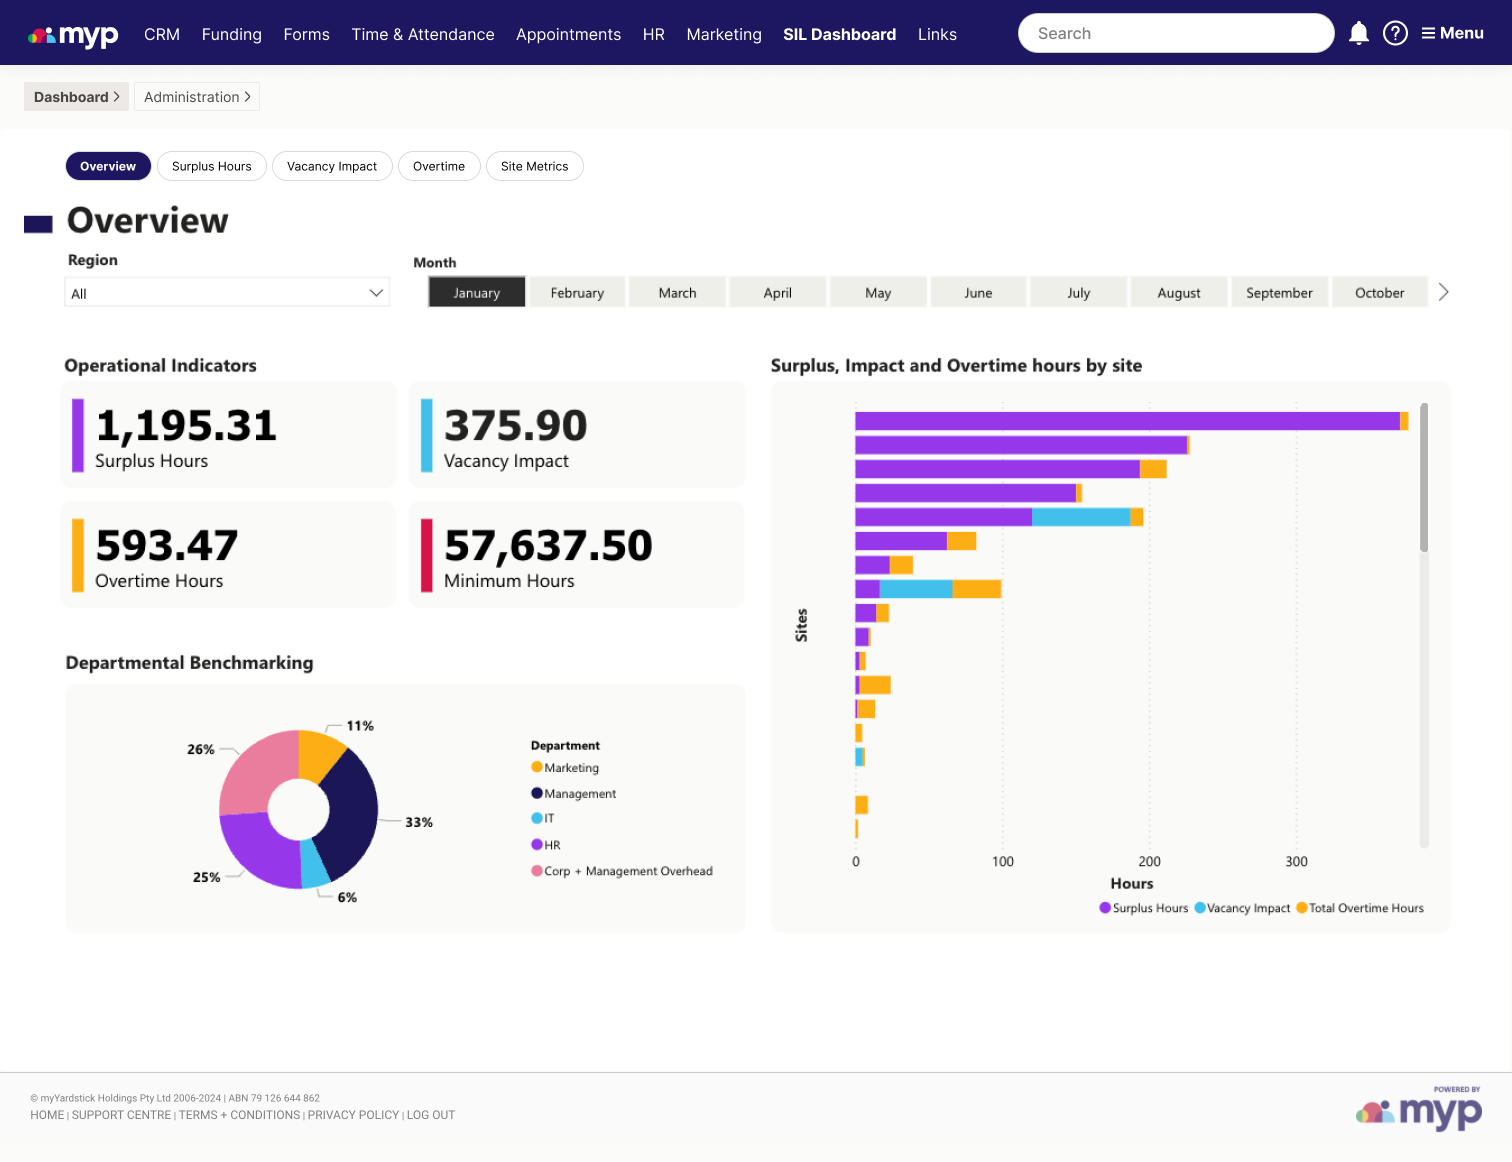
In SIL, under performance can be driven by vacancy and surplus hours. Frustratingly, most financial tools cannot differentiate between the two, or identify efficiency rosters when vacancies are at play. Our tool was designed to go beyond financial statements to understand exactly what is driving operating performance.
Market analysis, regulation decoding, and progressive thinking for providers who want to stay ahead in the NDIS
As the disability sector continues advocating for SIL price increases, it's worth examining the economic and political dynamics that...
Kafkaesque: The Moral Hazard at the Heart of SIL Dean Bowman November 18, 2025 Supported Independent Living The Federal...
There’s a persistent rumour in the disability sector that the National Disability Insurance Agency (NDIA) is slowly corralling services...
We partner with ambitious service providers who want to harness the power of the NDIS, not hide from its shortfalls. Together, we’re lifting the standard of service for everyone receiving supports.
We provide the managerial expertise, industry knowledge, and resources you need to consistently meet and exceed your business objectives.
Get in touch with us today by submitting an enquiry, booking a free consultation, or calling us directly at your convenience.
Omar Ahad | Care With Kindness
Join an exclusive community of providers receiving our eNewsletter Empathia Insider. Get first access to NDIS business insights, free provider resources, and special offers direct to your inbox.

Empathia Group is a collective of business consultants focused on creating sustainable, long-term success for NDIS service providers.
Appointments outside of standard business hours available by request
Empathia Group Pty Ltd © 2022. All rights reserved.
"Empathia Group found our path to market and now we are thriving"